Welsh Unemployment Among Women with Children Ages 6 to 17 years

COMPARE

Welsh
Race
Ancestry
AfghanAfricanAlaska NativeAlaskan AthabascanAlbanianAleutAlsatianAmericanApacheArabArapahoArgentineanArmenianAssyrian/Chaldean/SyriacAustralianAustrianBahamianBangladeshiBarbadianBasqueBelgianBelizeanBermudanBhutaneseBlackfeetBolivianBrazilianBritishBritish West IndianBulgarianBurmeseCajunCambodianCanadianCape VerdeanCarpatho RusynCelticCentral AmericanCentral American IndianCherokeeCheyenneChickasawChileanChineseChippewaChoctawColombianColvilleComancheCosta RicanCreeCreekCroatianCrowCubanCypriotCzechCzechoslovakianDanishDelawareDominicanDutchDutch West IndianEastern EuropeanEcuadorianEgyptianEnglishEstonianEthiopianEuropeanFijianFilipinoFinnishFrenchFrench American IndianFrench CanadianGermanGerman RussianGhanaianGreekGuamanian/ChamorroGuatemalanGuyaneseHaitianHmongHonduranHopiHoumaHungarianIcelanderIndian (Asian)IndonesianInupiatIranianIraqiIrishIroquoisIsraeliItalianJamaicanJapaneseJordanianKenyanKiowaKoreanLaotianLatvianLebaneseLiberianLithuanianLumbeeLuxembourgerMacedonianMalaysianMalteseMarshalleseMenomineeMexicanMexican American IndianMongolianMoroccanNative HawaiianNavajoNepaleseNew ZealanderNicaraguanNigerianNorthern EuropeanNorwegianOkinawanOsageOttawaPaiutePakistaniPalestinianPanamanianParaguayanPennsylvania GermanPeruvianPimaPolishPortuguesePotawatomiPuebloPuerto RicanPuget Sound SalishRomanianRussianSalvadoranSamoanScandinavianScotch-IrishScottishSeminoleSenegaleseSerbianShoshoneSierra LeoneanSiouxSlavicSlovakSloveneSomaliSouth AfricanSouth AmericanSouth American IndianSoviet UnionSpaniardSpanishSpanish AmericanSpanish American IndianSri LankanSubsaharan AfricanSudaneseSwedishSwissSyrianTaiwaneseThaiTlingit-HaidaTohono O'OdhamTonganTrinidadian and TobagonianTsimshianTurkishU.S. Virgin IslanderUgandanUkrainianUruguayanUteVenezuelanVietnameseWelshWest IndianYakamaYaquiYugoslavianYumanYup'ikZimbabwean
Immigration
NonimmigrantsImmigrantsAfghanistanAfricaAlbaniaArgentinaArmeniaAsiaAustraliaAustriaBahamasBangladeshBarbadosBelarusBelgiumBelizeBoliviaBosnia and HerzegovinaBrazilBulgariaBurma/MyanmarCabo VerdeCambodiaCameroonCanadaCaribbeanCentral AmericaChileChinaColombiaCongoCosta RicaCroatiaCubaCzechoslovakiaDenmarkDominicaDominican RepublicEastern AfricaEastern AsiaEastern EuropeEcuadorEgyptEl SalvadorEnglandEritreaEthiopiaEuropeFijiFranceGermanyGhanaGreeceGrenadaGuatemalaGuyanaHaitiHondurasHong KongHungaryIndiaIndonesiaIranIraqIrelandIsraelItalyJamaicaJapanJordanKazakhstanKenyaKoreaKuwaitLaosLatin AmericaLatviaLebanonLiberiaLithuaniaMalaysiaMexicoMicronesiaMiddle AfricaMoldovaMoroccoNepalNetherlandsNicaraguaNigeriaNorth AmericaNorth MacedoniaNorthern AfricaNorthern EuropeNorwayOceaniaPakistanPanamaPeruPhilippinesPolandPortugalRomaniaRussiaSaudi ArabiaScotlandSenegalSerbiaSierra LeoneSingaporeSomaliaSouth AfricaSouth AmericaSouth Central AsiaSouth Eastern AsiaSouthern EuropeSpainSri LankaSt. Vincent and the GrenadinesSudanSwedenSwitzerlandSyriaTaiwanThailandTrinidad and TobagoTurkeyUgandaUkraineUruguayUzbekistanVenezuelaVietnamWest IndiesWestern AfricaWestern AsiaWestern EuropeYemenZaireZimbabweAzores
Select to Compare
Race
Ancestry
AfghanAfricanAlaska NativeAlaskan AthabascanAlbanianAleutAlsatianAmericanApacheArabArapahoArgentineanArmenianAssyrian/Chaldean/SyriacAustralianAustrianBahamianBangladeshiBarbadianBasqueBelgianBelizeanBermudanBhutaneseBlackfeetBolivianBrazilianBritishBritish West IndianBulgarianBurmeseCajunCambodianCanadianCape VerdeanCarpatho RusynCelticCentral AmericanCentral American IndianCherokeeCheyenneChickasawChileanChineseChippewaChoctawColombianColvilleComancheCosta RicanCreeCreekCroatianCrowCubanCypriotCzechCzechoslovakianDanishDelawareDominicanDutchDutch West IndianEastern EuropeanEcuadorianEgyptianEnglishEstonianEthiopianEuropeanFijianFilipinoFinnishFrenchFrench American IndianFrench CanadianGermanGerman RussianGhanaianGreekGuamanian/ChamorroGuatemalanGuyaneseHaitianHmongHonduranHopiHoumaHungarianIcelanderIndian (Asian)IndonesianInupiatIranianIraqiIrishIroquoisIsraeliItalianJamaicanJapaneseJordanianKenyanKiowaKoreanLaotianLatvianLebaneseLiberianLithuanianLumbeeLuxembourgerMacedonianMalaysianMalteseMarshalleseMenomineeMexicanMexican American IndianMongolianMoroccanNative HawaiianNavajoNepaleseNew ZealanderNicaraguanNigerianNorthern EuropeanNorwegianOkinawanOsageOttawaPaiutePakistaniPalestinianPanamanianParaguayanPennsylvania GermanPeruvianPimaPolishPortuguesePotawatomiPuebloPuerto RicanPuget Sound SalishRomanianRussianSalvadoranSamoanScandinavianScotch-IrishScottishSeminoleSenegaleseSerbianShoshoneSierra LeoneanSiouxSlavicSlovakSloveneSomaliSouth AfricanSouth AmericanSouth American IndianSoviet UnionSpaniardSpanishSpanish AmericanSpanish American IndianSri LankanSubsaharan AfricanSudaneseSwedishSwissSyrianTaiwaneseThaiTlingit-HaidaTohono O'OdhamTonganTrinidadian and TobagonianTsimshianTurkishU.S. Virgin IslanderUgandanUkrainianUruguayanUteVenezuelanVietnameseWest IndianYakamaYaquiYugoslavianYumanYup'ikZimbabwean
Immigration
NonimmigrantsImmigrantsAfghanistanAfricaAlbaniaArgentinaArmeniaAsiaAustraliaAustriaBahamasBangladeshBarbadosBelarusBelgiumBelizeBoliviaBosnia and HerzegovinaBrazilBulgariaBurma/MyanmarCabo VerdeCambodiaCameroonCanadaCaribbeanCentral AmericaChileChinaColombiaCongoCosta RicaCroatiaCubaCzechoslovakiaDenmarkDominicaDominican RepublicEastern AfricaEastern AsiaEastern EuropeEcuadorEgyptEl SalvadorEnglandEritreaEthiopiaEuropeFijiFranceGermanyGhanaGreeceGrenadaGuatemalaGuyanaHaitiHondurasHong KongHungaryIndiaIndonesiaIranIraqIrelandIsraelItalyJamaicaJapanJordanKazakhstanKenyaKoreaKuwaitLaosLatin AmericaLatviaLebanonLiberiaLithuaniaMalaysiaMexicoMicronesiaMiddle AfricaMoldovaMoroccoNepalNetherlandsNicaraguaNigeriaNorth AmericaNorth MacedoniaNorthern AfricaNorthern EuropeNorwayOceaniaPakistanPanamaPeruPhilippinesPolandPortugalRomaniaRussiaSaudi ArabiaScotlandSenegalSerbiaSierra LeoneSingaporeSomaliaSouth AfricaSouth AmericaSouth Central AsiaSouth Eastern AsiaSouthern EuropeSpainSri LankaSt. Vincent and the GrenadinesSudanSwedenSwitzerlandSyriaTaiwanThailandTrinidad and TobagoTurkeyUgandaUkraineUruguayUzbekistanVenezuelaVietnamWest IndiesWestern AfricaWestern AsiaWestern EuropeYemenZaireZimbabweAzores
Unemployment Among Women with Children Ages 6 to 17 years
Income
Poverty
Unemployment
Labor Participation
Family Structure
Vehicle Availability
Education Level
Disability

Welsh Unemployment Among Women with Children Ages 6 to 17 years
Tragic

9.3%
UNEMPLOYMENT | WOMEN W/ CHILDREN 6 TO 17
4.0/ 100
METRIC RATING
230th/ 347
METRIC RANK

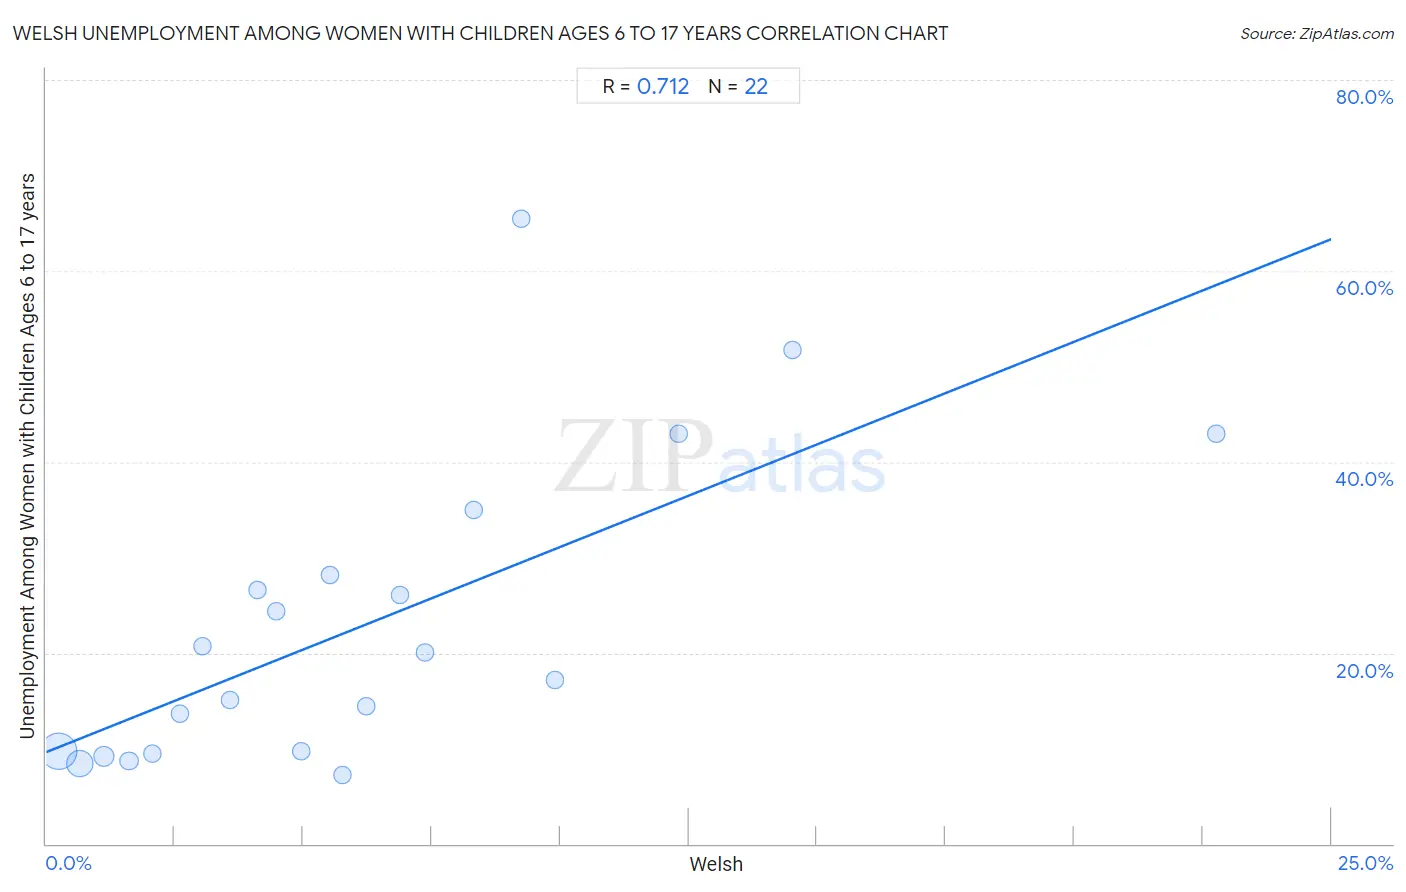
Welsh Unemployment Among Women with Children Ages 6 to 17 years Correlation Chart

The statistical analysis conducted on geographies consisting of 338,386,980 people shows a strong positive correlation between the proportion of Welsh and unemployment rate among women with children between the ages 6 and 17 in the United States with a correlation coefficient (R) of 0.712 and weighted average of 9.3%. On average, for every 1% (one percent) increase in Welsh within a typical geography, there is an increase of 2.1% in unemployment rate among women with children between the ages 6 and 17.
Welsh Unemployment Among Women with Children Ages 6 to 17 years
It is essential to understand that the correlation between the percentage of Welsh and unemployment rate among women with children between the ages 6 and 17 does not imply a direct cause-and-effect relationship. It remains uncertain whether the presence of Welsh influences an upward or downward trend in the level of unemployment rate among women with children between the ages 6 and 17 within an area, or if Welsh simply ended up residing in those areas with higher or lower levels of unemployment rate among women with children between the ages 6 and 17 due to other factors.

Demographics Similar to Welsh by Unemployment Among Women with Children Ages 6 to 17 years

In terms of unemployment among women with children ages 6 to 17 years, the demographic groups most similar to Welsh are Macedonian (9.3%, a difference of 0.010%), French American Indian (9.3%, a difference of 0.070%), Lumbee (9.3%, a difference of 0.090%), Estonian (9.3%, a difference of 0.13%), and Panamanian (9.3%, a difference of 0.15%).
DemographicsRating | RankUnemployment Among Women with Children Ages 6 to 17 years
Immigrants from Eritrea
5.8
/100
|
#223
Tragic
9.2%
Immigrants from El Salvador
5.3
/100
|
#224
Tragic
9.3%
Chinese
5.2
/100
|
#225
Tragic
9.3%
Immigrants from the Azores
4.6
/100
|
#226
Tragic
9.3%
Panamanians
4.5
/100
|
#227
Tragic
9.3%
Estonians
4.4
/100
|
#228
Tragic
9.3%
Lumbee
4.3
/100
|
#229
Tragic
9.3%
Welsh
4.0
/100
|
#230
Tragic
9.3%
Macedonians
3.9
/100
|
#231
Tragic
9.3%
French American Indians
3.7
/100
|
#232
Tragic
9.3%
Immigrants from St. Vincent and the Grenadines
3.3
/100
|
#233
Tragic
9.3%
Mexicans
3.2
/100
|
#234
Tragic
9.3%
Uruguayans
3.0
/100
|
#235
Tragic
9.3%
Hungarians
3.0
/100
|
#236
Tragic
9.3%
Immigrants from Belize
2.8
/100
|
#237
Tragic
9.3%

Welsh Unemployment Among Women with Children Ages 6 to 17 years Correlation Summary

MeasurementWelsh DataUnemployment Among Women with Children Ages 6 to 17 years Data
Minimum0.23%7.2%
Maximum22.8%65.4%
Range22.5%58.2%
Mean6.2%23.0%
Median5.2%18.6%
Interquartile 25% (IQ1)2.6%9.7%
Interquartile 75% (IQ3)8.3%28.2%
Interquartile Range (IQR)5.7%18.5%
Standard Deviation (Sample)5.3%15.9%
Standard Deviation (Population)5.1%15.5%

Correlation Details

Welsh PercentileSample SizeUnemployment Among Women with Children Ages 6 to 17 years
[
0.0%
-
0.5%
]
0.23%
203,555,0229.7%
[
0.5%
-
1.0%
]
0.66%
99,487,8348.4%
[
1.0%
-
1.5%
]
1.12%
24,536,2599.1%
[
1.5%
-
2.0%
]
1.61%
6,537,9968.7%
[
2.0%
-
2.5%
]
2.07%
2,440,4789.5%
[
2.5%
-
3.0%
]
2.61%
1,023,91213.6%
[
3.0%
-
3.5%
]
3.05%
248,55620.6%
[
3.5%
-
4.0%
]
3.57%
238,32315.1%
[
4.0%
-
4.5%
]
4.11%
71,22626.6%
[
4.0%
-
4.5%
]
4.49%
23,82924.4%
[
4.5%
-
5.0%
]
4.97%
103,2849.7%
[
5.5%
-
6.0%
]
5.52%
30,14928.2%
[
5.5%
-
6.0%
]
5.76%
22,8297.2%
[
6.0%
-
6.5%
]
6.23%
18,72814.3%
[
6.5%
-
7.0%
]
6.88%
4,98626.1%
[
7.0%
-
7.5%
]
7.36%
14,16720.1%
[
8.0%
-
8.5%
]
8.32%
11,29434.9%
[
9.0%
-
9.5%
]
9.24%
3,90765.4%
[
9.5%
-
10.0%
]
9.89%
2,19417.2%
[
12.0%
-
12.5%
]
12.30%
6,27442.9%
[
14.5%
-
15.0%
]
14.51%
5,32051.7%
[
22.5%
-
23.0%
]
22.76%
41342.9%