Thai Married-couple Households
COMPARE
Thai
Select to Compare
Married-couple Households
Thai Married-couple Households
51.9%
MARRIED-COUPLE HOUSEHOLDS
100.0/ 100
METRIC RATING
3rd/ 347
METRIC RANK
Thai Married-couple Households Correlation Chart
The statistical analysis conducted on geographies consisting of 475,348,785 people shows a moderate positive correlation between the proportion of Thais and percentage of married-couple family households in the United States with a correlation coefficient (R) of 0.425 and weighted average of 51.9%. On average, for every 1% (one percent) increase in Thais within a typical geography, there is an increase of 0.30% in percentage of married-couple family households.
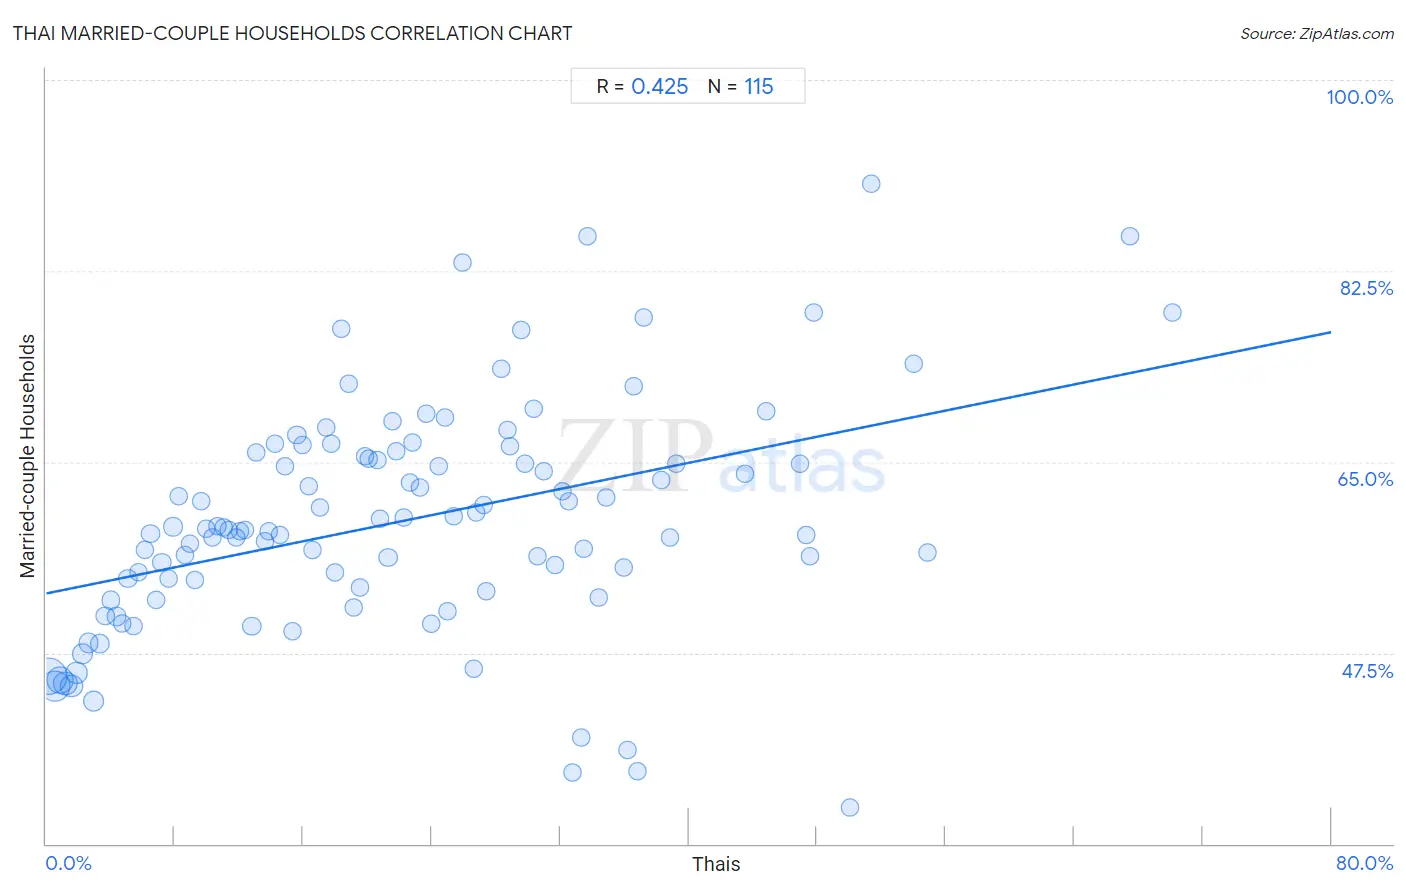
It is essential to understand that the correlation between the percentage of Thais and percentage of married-couple family households does not imply a direct cause-and-effect relationship. It remains uncertain whether the presence of Thais influences an upward or downward trend in the level of percentage of married-couple family households within an area, or if Thais simply ended up residing in those areas with higher or lower levels of percentage of married-couple family households due to other factors.
Demographics Similar to Thais by Married-couple Households
In terms of married-couple households, the demographic groups most similar to Thais are Assyrian/Chaldean/Syriac (51.8%, a difference of 0.21%), Tongan (51.6%, a difference of 0.68%), Immigrants from Taiwan (52.4%, a difference of 0.97%), Immigrants from India (52.7%, a difference of 1.6%), and Danish (51.1%, a difference of 1.7%).
| Demographics | Rating | Rank | Married-couple Households |
| Immigrants from India | 100.0 /100 | #1 | Exceptional 52.7% |
| Immigrants from Taiwan | 100.0 /100 | #2 | Exceptional 52.4% |
| Thais | 100.0 /100 | #3 | Exceptional 51.9% |
| Assyrians/Chaldeans/Syriacs | 100.0 /100 | #4 | Exceptional 51.8% |
| Tongans | 100.0 /100 | #5 | Exceptional 51.6% |
| Danes | 100.0 /100 | #6 | Exceptional 51.1% |
| Filipinos | 100.0 /100 | #7 | Exceptional 51.0% |
| Immigrants from South Central Asia | 100.0 /100 | #8 | Exceptional 50.6% |
| Pennsylvania Germans | 100.0 /100 | #9 | Exceptional 50.4% |
| Chinese | 100.0 /100 | #10 | Exceptional 50.4% |
| Immigrants from Pakistan | 100.0 /100 | #11 | Exceptional 50.1% |
| Swiss | 100.0 /100 | #12 | Exceptional 49.9% |
| Immigrants from Korea | 100.0 /100 | #13 | Exceptional 49.9% |
| Burmese | 100.0 /100 | #14 | Exceptional 49.8% |
| Koreans | 99.9 /100 | #15 | Exceptional 49.7% |
Thai Married-couple Households Correlation Summary
| Measurement | Thai Data | Married-couple Households Data |
| Minimum | 0.16% | 33.3% |
| Maximum | 70.1% | 90.5% |
| Range | 69.9% | 57.2% |
| Mean | 22.0% | 59.5% |
| Median | 20.1% | 58.8% |
| Interquartile 25% (IQ1) | 9.9% | 53.1% |
| Interquartile 75% (IQ3) | 31.7% | 65.6% |
| Interquartile Range (IQR) | 21.7% | 12.4% |
| Standard Deviation (Sample) | 15.0% | 10.5% |
| Standard Deviation (Population) | 14.9% | 10.5% |
Correlation Details
| Thai Percentile | Sample Size | Married-couple Households |
[ 0.0% - 0.5% ] 0.16% | 128,248,431 | 45.3% |
[ 0.5% - 1.0% ] 0.52% | 86,187,405 | 44.4% |
[ 0.5% - 1.0% ] 0.86% | 59,075,021 | 45.0% |
[ 1.0% - 1.5% ] 1.20% | 38,245,172 | 44.7% |
[ 1.5% - 2.0% ] 1.56% | 30,157,032 | 44.5% |
[ 1.5% - 2.0% ] 1.90% | 20,915,372 | 45.7% |
[ 2.0% - 2.5% ] 2.27% | 16,577,889 | 47.4% |
[ 2.5% - 3.0% ] 2.61% | 11,486,988 | 48.4% |
[ 2.5% - 3.0% ] 2.96% | 18,904,003 | 43.1% |
[ 3.0% - 3.5% ] 3.32% | 10,517,068 | 48.3% |
[ 3.5% - 4.0% ] 3.67% | 5,319,533 | 50.9% |
[ 4.0% - 4.5% ] 4.02% | 5,329,711 | 52.3% |
[ 4.0% - 4.5% ] 4.38% | 4,937,092 | 50.8% |
[ 4.5% - 5.0% ] 4.73% | 3,885,624 | 50.2% |
[ 5.0% - 5.5% ] 5.09% | 3,396,322 | 54.3% |
[ 5.0% - 5.5% ] 5.42% | 2,259,654 | 49.9% |
[ 5.5% - 6.0% ] 5.76% | 3,263,158 | 54.9% |
[ 6.0% - 6.5% ] 6.16% | 1,859,821 | 56.9% |
[ 6.0% - 6.5% ] 6.50% | 1,515,426 | 58.4% |
[ 6.5% - 7.0% ] 6.81% | 1,473,279 | 52.3% |
[ 7.0% - 7.5% ] 7.20% | 1,112,897 | 55.7% |
[ 7.5% - 8.0% ] 7.60% | 1,952,070 | 54.3% |
[ 7.5% - 8.0% ] 7.89% | 1,148,534 | 59.1% |
[ 8.0% - 8.5% ] 8.24% | 792,698 | 61.8% |
[ 8.5% - 9.0% ] 8.62% | 863,766 | 56.4% |
[ 8.5% - 9.0% ] 8.98% | 603,427 | 57.5% |
[ 9.0% - 9.5% ] 9.29% | 718,822 | 54.2% |
[ 9.5% - 10.0% ] 9.63% | 700,794 | 61.4% |
[ 9.5% - 10.0% ] 9.95% | 641,314 | 58.8% |
[ 10.0% - 10.5% ] 10.36% | 529,032 | 58.1% |
[ 10.5% - 11.0% ] 10.67% | 549,270 | 59.1% |
[ 11.0% - 11.5% ] 11.08% | 652,132 | 59.0% |
[ 11.0% - 11.5% ] 11.38% | 927,231 | 58.8% |
[ 11.5% - 12.0% ] 11.82% | 180,516 | 58.1% |
[ 12.0% - 12.5% ] 12.07% | 526,284 | 58.7% |
[ 12.0% - 12.5% ] 12.38% | 427,516 | 58.8% |
[ 12.5% - 13.0% ] 12.80% | 843,636 | 49.9% |
[ 13.0% - 13.5% ] 13.11% | 424,251 | 65.8% |
[ 13.5% - 14.0% ] 13.63% | 483,514 | 57.7% |
[ 13.5% - 14.0% ] 13.87% | 299,708 | 58.6% |
[ 14.0% - 14.5% ] 14.23% | 373,447 | 66.7% |
[ 14.5% - 15.0% ] 14.56% | 678,696 | 58.3% |
[ 14.5% - 15.0% ] 14.89% | 213,574 | 64.6% |
[ 15.0% - 15.5% ] 15.35% | 394,649 | 49.4% |
[ 15.5% - 16.0% ] 15.60% | 235,822 | 67.4% |
[ 15.5% - 16.0% ] 15.96% | 145,079 | 66.6% |
[ 16.0% - 16.5% ] 16.34% | 95,398 | 62.8% |
[ 16.5% - 17.0% ] 16.61% | 210,115 | 56.9% |
[ 17.0% - 17.5% ] 17.02% | 78,602 | 60.9% |
[ 17.0% - 17.5% ] 17.47% | 34,484 | 68.2% |
[ 17.5% - 18.0% ] 17.72% | 483,550 | 66.6% |
[ 18.0% - 18.5% ] 18.00% | 258,637 | 54.9% |
[ 18.0% - 18.5% ] 18.36% | 95,553 | 77.2% |
[ 18.5% - 19.0% ] 18.82% | 158,081 | 72.2% |
[ 19.0% - 19.5% ] 19.14% | 10,341 | 51.7% |
[ 19.5% - 20.0% ] 19.51% | 332,773 | 53.5% |
[ 19.5% - 20.0% ] 19.85% | 121,376 | 65.6% |
[ 20.0% - 20.5% ] 20.10% | 223,691 | 65.3% |
[ 20.5% - 21.0% ] 20.61% | 85,133 | 65.2% |
[ 20.5% - 21.0% ] 20.81% | 269,353 | 59.7% |
[ 21.0% - 21.5% ] 21.28% | 139,153 | 56.3% |
[ 21.5% - 22.0% ] 21.57% | 97,178 | 68.7% |
[ 21.5% - 22.0% ] 21.83% | 103,197 | 66.0% |
[ 22.0% - 22.5% ] 22.29% | 120,806 | 59.9% |
[ 22.5% - 23.0% ] 22.68% | 208,151 | 63.1% |
[ 22.5% - 23.0% ] 22.84% | 106,155 | 66.7% |
[ 23.0% - 23.5% ] 23.25% | 36,973 | 62.6% |
[ 23.5% - 24.0% ] 23.64% | 101,208 | 69.4% |
[ 23.5% - 24.0% ] 23.95% | 48,552 | 50.1% |
[ 24.0% - 24.5% ] 24.45% | 248,641 | 64.6% |
[ 24.5% - 25.0% ] 24.81% | 8,456 | 69.1% |
[ 25.0% - 25.5% ] 25.01% | 20,651 | 51.3% |
[ 25.0% - 25.5% ] 25.35% | 30,207 | 60.0% |
[ 25.5% - 26.0% ] 25.88% | 653 | 83.3% |
[ 26.5% - 27.0% ] 26.61% | 27,571 | 46.1% |
[ 26.5% - 27.0% ] 26.78% | 114,355 | 60.4% |
[ 27.0% - 27.5% ] 27.23% | 188,552 | 61.1% |
[ 27.0% - 27.5% ] 27.38% | 22,852 | 53.1% |
[ 28.0% - 28.5% ] 28.34% | 18,949 | 73.6% |
[ 28.5% - 29.0% ] 28.70% | 69,659 | 68.0% |
[ 28.5% - 29.0% ] 28.87% | 95,566 | 66.4% |
[ 29.5% - 30.0% ] 29.55% | 63,620 | 77.0% |
[ 29.5% - 30.0% ] 29.83% | 257,729 | 64.8% |
[ 30.0% - 30.5% ] 30.38% | 76,956 | 69.8% |
[ 30.5% - 31.0% ] 30.61% | 51,153 | 56.3% |
[ 30.5% - 31.0% ] 30.99% | 102,097 | 64.1% |
[ 31.5% - 32.0% ] 31.68% | 30,392 | 55.5% |
[ 32.0% - 32.5% ] 32.12% | 3,695 | 62.3% |
[ 32.5% - 33.0% ] 32.52% | 61,363 | 61.4% |
[ 32.5% - 33.0% ] 32.75% | 2,766 | 36.5% |
[ 33.0% - 33.5% ] 33.28% | 5,018 | 39.8% |
[ 33.0% - 33.5% ] 33.44% | 21,806 | 57.1% |
[ 33.5% - 34.0% ] 33.67% | 802 | 85.7% |
[ 34.0% - 34.5% ] 34.38% | 15,702 | 52.6% |
[ 34.5% - 35.0% ] 34.86% | 68,587 | 61.7% |
[ 35.5% - 36.0% ] 35.98% | 29,756 | 55.3% |
[ 36.0% - 36.5% ] 36.21% | 2,994 | 38.6% |
[ 36.5% - 37.0% ] 36.59% | 20,954 | 72.0% |
[ 36.5% - 37.0% ] 36.84% | 1,425 | 36.6% |
[ 37.0% - 37.5% ] 37.20% | 53,464 | 78.2% |
[ 38.0% - 38.5% ] 38.27% | 23,274 | 63.3% |
[ 38.5% - 39.0% ] 38.87% | 2,560 | 58.1% |
[ 39.0% - 39.5% ] 39.23% | 6,773 | 64.8% |
[ 43.0% - 43.5% ] 43.50% | 9,750 | 63.9% |
[ 44.5% - 45.0% ] 44.79% | 53,744 | 69.6% |
[ 46.5% - 47.0% ] 46.92% | 21,452 | 64.8% |
[ 47.0% - 47.5% ] 47.30% | 20,693 | 58.3% |
[ 47.5% - 48.0% ] 47.55% | 44,570 | 56.3% |
[ 47.5% - 48.0% ] 47.76% | 10,514 | 78.7% |
[ 50.0% - 50.5% ] 50.00% | 8 | 33.3% |
[ 51.0% - 51.5% ] 51.35% | 2,300 | 90.5% |
[ 53.5% - 54.0% ] 53.99% | 40,614 | 74.0% |
[ 54.5% - 55.0% ] 54.84% | 2,241 | 56.7% |
[ 67.0% - 67.5% ] 67.45% | 212 | 85.7% |
[ 70.0% - 70.5% ] 70.11% | 2,549 | 78.7% |