Thai Unemployment Among Women with Children Ages 6 to 17 years
COMPARE
Thai
Select to Compare
Unemployment Among Women with Children Ages 6 to 17 years
Thai Unemployment Among Women with Children Ages 6 to 17 years
7.8%
UNEMPLOYMENT | WOMEN W/ CHILDREN 6 TO 17
100.0/ 100
METRIC RATING
29th/ 347
METRIC RANK
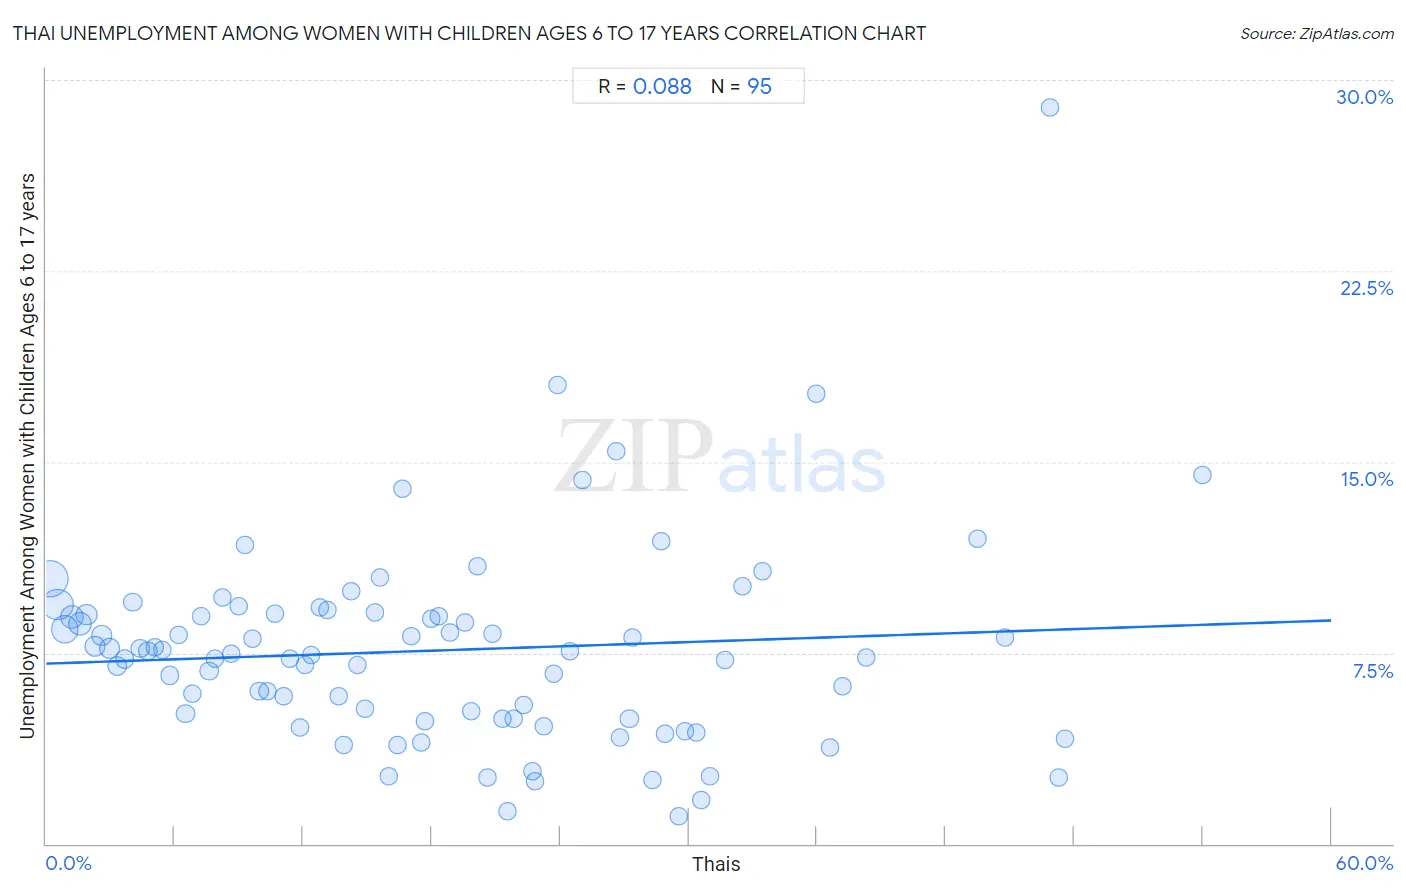
Thai Unemployment Among Women with Children Ages 6 to 17 years Correlation Chart
The statistical analysis conducted on geographies consisting of 328,573,695 people shows a slight positive correlation between the proportion of Thais and unemployment rate among women with children between the ages 6 and 17 in the United States with a correlation coefficient (R) of 0.088 and weighted average of 7.8%. On average, for every 1% (one percent) increase in Thais within a typical geography, there is an increase of 0.028% in unemployment rate among women with children between the ages 6 and 17.
It is essential to understand that the correlation between the percentage of Thais and unemployment rate among women with children between the ages 6 and 17 does not imply a direct cause-and-effect relationship. It remains uncertain whether the presence of Thais influences an upward or downward trend in the level of unemployment rate among women with children between the ages 6 and 17 within an area, or if Thais simply ended up residing in those areas with higher or lower levels of unemployment rate among women with children between the ages 6 and 17 due to other factors.
Demographics Similar to Thais by Unemployment Among Women with Children Ages 6 to 17 years
In terms of unemployment among women with children ages 6 to 17 years, the demographic groups most similar to Thais are Immigrants from Uzbekistan (7.8%, a difference of 0.34%), Immigrants from Afghanistan (7.8%, a difference of 0.67%), Immigrants from Iran (7.9%, a difference of 0.89%), Laotian (7.9%, a difference of 1.1%), and Immigrants from Cambodia (7.9%, a difference of 1.1%).
| Demographics | Rating | Rank | Unemployment Among Women with Children Ages 6 to 17 years |
| Immigrants from China | 100.0 /100 | #22 | Exceptional 7.7% |
| Immigrants from Indonesia | 100.0 /100 | #23 | Exceptional 7.7% |
| Nepalese | 100.0 /100 | #24 | Exceptional 7.7% |
| Immigrants from Eastern Asia | 100.0 /100 | #25 | Exceptional 7.7% |
| Indians (Asian) | 100.0 /100 | #26 | Exceptional 7.7% |
| Immigrants from Afghanistan | 100.0 /100 | #27 | Exceptional 7.8% |
| Immigrants from Uzbekistan | 100.0 /100 | #28 | Exceptional 7.8% |
| Thais | 100.0 /100 | #29 | Exceptional 7.8% |
| Immigrants from Iran | 100.0 /100 | #30 | Exceptional 7.9% |
| Laotians | 100.0 /100 | #31 | Exceptional 7.9% |
| Immigrants from Cambodia | 100.0 /100 | #32 | Exceptional 7.9% |
| Immigrants from Korea | 100.0 /100 | #33 | Exceptional 7.9% |
| Native Hawaiians | 100.0 /100 | #34 | Exceptional 7.9% |
| Immigrants from South Central Asia | 100.0 /100 | #35 | Exceptional 7.9% |
| Burmese | 100.0 /100 | #36 | Exceptional 8.0% |
Thai Unemployment Among Women with Children Ages 6 to 17 years Correlation Summary
| Measurement | Thai Data | Unemployment Among Women with Children Ages 6 to 17 years Data |
| Minimum | 0.16% | 1.1% |
| Maximum | 54.0% | 28.9% |
| Range | 53.8% | 27.8% |
| Mean | 18.3% | 7.6% |
| Median | 16.6% | 7.5% |
| Interquartile 25% (IQ1) | 8.2% | 4.9% |
| Interquartile 75% (IQ3) | 26.8% | 9.0% |
| Interquartile Range (IQR) | 18.5% | 4.1% |
| Standard Deviation (Sample) | 12.5% | 4.0% |
| Standard Deviation (Population) | 12.4% | 4.0% |
Correlation Details
| Thai Percentile | Sample Size | Unemployment Among Women with Children Ages 6 to 17 years |
[ 0.0% - 0.5% ] 0.16% | 85,049,145 | 10.4% |
[ 0.5% - 1.0% ] 0.52% | 60,854,384 | 9.4% |
[ 0.5% - 1.0% ] 0.86% | 41,004,598 | 8.4% |
[ 1.0% - 1.5% ] 1.20% | 27,802,579 | 8.9% |
[ 1.5% - 2.0% ] 1.55% | 22,262,770 | 8.6% |
[ 1.5% - 2.0% ] 1.89% | 14,049,219 | 9.0% |
[ 2.0% - 2.5% ] 2.26% | 11,173,186 | 7.7% |
[ 2.5% - 3.0% ] 2.59% | 7,164,089 | 8.2% |
[ 2.5% - 3.0% ] 2.95% | 15,400,302 | 7.7% |
[ 3.0% - 3.5% ] 3.32% | 7,602,596 | 7.0% |
[ 3.5% - 4.0% ] 3.65% | 2,786,820 | 7.3% |
[ 4.0% - 4.5% ] 4.03% | 3,097,876 | 9.5% |
[ 4.0% - 4.5% ] 4.40% | 3,331,705 | 7.7% |
[ 4.5% - 5.0% ] 4.73% | 2,725,971 | 7.6% |
[ 5.0% - 5.5% ] 5.07% | 1,912,191 | 7.7% |
[ 5.0% - 5.5% ] 5.42% | 1,367,121 | 7.6% |
[ 5.5% - 6.0% ] 5.76% | 2,188,010 | 6.6% |
[ 6.0% - 6.5% ] 6.19% | 857,151 | 8.2% |
[ 6.5% - 7.0% ] 6.50% | 978,472 | 5.1% |
[ 6.5% - 7.0% ] 6.81% | 825,119 | 5.9% |
[ 7.0% - 7.5% ] 7.21% | 725,229 | 8.9% |
[ 7.5% - 8.0% ] 7.62% | 1,652,485 | 6.8% |
[ 7.5% - 8.0% ] 7.90% | 695,579 | 7.3% |
[ 8.0% - 8.5% ] 8.25% | 446,337 | 9.7% |
[ 8.5% - 9.0% ] 8.62% | 443,354 | 7.5% |
[ 9.0% - 9.5% ] 9.00% | 299,868 | 9.3% |
[ 9.0% - 9.5% ] 9.29% | 572,830 | 11.7% |
[ 9.5% - 10.0% ] 9.61% | 508,289 | 8.1% |
[ 9.5% - 10.0% ] 9.95% | 543,241 | 6.0% |
[ 10.0% - 10.5% ] 10.34% | 377,245 | 6.0% |
[ 10.5% - 11.0% ] 10.68% | 271,806 | 9.0% |
[ 11.0% - 11.5% ] 11.07% | 427,447 | 5.8% |
[ 11.0% - 11.5% ] 11.38% | 689,861 | 7.3% |
[ 11.5% - 12.0% ] 11.83% | 147,930 | 4.5% |
[ 12.0% - 12.5% ] 12.07% | 379,995 | 7.0% |
[ 12.0% - 12.5% ] 12.38% | 307,757 | 7.4% |
[ 12.5% - 13.0% ] 12.79% | 792,271 | 9.3% |
[ 13.0% - 13.5% ] 13.10% | 322,972 | 9.2% |
[ 13.5% - 14.0% ] 13.63% | 382,562 | 5.8% |
[ 13.5% - 14.0% ] 13.88% | 253,657 | 3.9% |
[ 14.0% - 14.5% ] 14.23% | 337,801 | 9.9% |
[ 14.5% - 15.0% ] 14.55% | 509,204 | 7.0% |
[ 14.5% - 15.0% ] 14.86% | 105,689 | 5.3% |
[ 15.0% - 15.5% ] 15.36% | 363,504 | 9.1% |
[ 15.5% - 16.0% ] 15.57% | 134,113 | 10.5% |
[ 15.5% - 16.0% ] 16.00% | 79,743 | 2.6% |
[ 16.0% - 16.5% ] 16.37% | 61,304 | 3.9% |
[ 16.5% - 17.0% ] 16.64% | 156,521 | 13.9% |
[ 17.0% - 17.5% ] 17.02% | 46,994 | 8.2% |
[ 17.5% - 18.0% ] 17.51% | 28,337 | 4.0% |
[ 17.5% - 18.0% ] 17.70% | 366,681 | 4.8% |
[ 18.0% - 18.5% ] 18.00% | 241,179 | 8.8% |
[ 18.0% - 18.5% ] 18.35% | 74,673 | 8.9% |
[ 18.5% - 19.0% ] 18.84% | 109,699 | 8.3% |
[ 19.5% - 20.0% ] 19.53% | 218,117 | 8.7% |
[ 19.5% - 20.0% ] 19.84% | 99,346 | 5.2% |
[ 20.0% - 20.5% ] 20.11% | 190,481 | 10.9% |
[ 20.5% - 21.0% ] 20.62% | 84,480 | 2.6% |
[ 20.5% - 21.0% ] 20.83% | 213,289 | 8.2% |
[ 21.0% - 21.5% ] 21.29% | 124,809 | 4.9% |
[ 21.5% - 22.0% ] 21.56% | 78,691 | 1.3% |
[ 21.5% - 22.0% ] 21.83% | 101,053 | 4.9% |
[ 22.0% - 22.5% ] 22.29% | 120,806 | 5.4% |
[ 22.5% - 23.0% ] 22.68% | 208,151 | 2.8% |
[ 22.5% - 23.0% ] 22.84% | 91,503 | 2.4% |
[ 23.0% - 23.5% ] 23.22% | 21,402 | 4.6% |
[ 23.5% - 24.0% ] 23.69% | 66,046 | 6.7% |
[ 23.5% - 24.0% ] 23.87% | 27,794 | 18.0% |
[ 24.0% - 24.5% ] 24.45% | 248,641 | 7.6% |
[ 25.0% - 25.5% ] 25.01% | 20,339 | 14.3% |
[ 26.5% - 27.0% ] 26.61% | 27,571 | 15.4% |
[ 26.5% - 27.0% ] 26.78% | 114,355 | 4.2% |
[ 27.0% - 27.5% ] 27.23% | 188,552 | 4.9% |
[ 27.0% - 27.5% ] 27.36% | 19,544 | 8.1% |
[ 28.0% - 28.5% ] 28.33% | 13,948 | 2.5% |
[ 28.5% - 29.0% ] 28.69% | 60,635 | 11.9% |
[ 28.5% - 29.0% ] 28.91% | 48,096 | 4.3% |
[ 29.5% - 30.0% ] 29.54% | 62,554 | 1.1% |
[ 29.5% - 30.0% ] 29.83% | 250,590 | 4.4% |
[ 30.0% - 30.5% ] 30.38% | 71,366 | 4.4% |
[ 30.5% - 31.0% ] 30.61% | 51,153 | 1.7% |
[ 31.0% - 31.5% ] 31.01% | 67,652 | 2.7% |
[ 31.5% - 32.0% ] 31.68% | 30,392 | 7.2% |
[ 32.5% - 33.0% ] 32.52% | 61,363 | 10.1% |
[ 33.0% - 33.5% ] 33.44% | 21,806 | 10.7% |
[ 35.5% - 36.0% ] 35.98% | 29,756 | 17.7% |
[ 36.5% - 37.0% ] 36.59% | 20,954 | 3.8% |
[ 37.0% - 37.5% ] 37.20% | 53,464 | 6.2% |
[ 38.0% - 38.5% ] 38.26% | 18,068 | 7.3% |
[ 43.0% - 43.5% ] 43.50% | 9,750 | 12.0% |
[ 44.5% - 45.0% ] 44.78% | 37,022 | 8.1% |
[ 46.5% - 47.0% ] 46.89% | 5,867 | 28.9% |
[ 47.0% - 47.5% ] 47.30% | 20,693 | 2.6% |
[ 47.5% - 48.0% ] 47.55% | 44,570 | 4.1% |
[ 53.5% - 54.0% ] 53.98% | 39,565 | 14.5% |