Thai 3 or more Vehicles in Household
COMPARE
Thai
Select to Compare
3 or more Vehicles in Household
Thai 3 or more Vehicles in Household
19.8%
3+ VEHICLES AVAILABLE
71.1/ 100
METRIC RATING
156th/ 347
METRIC RANK
Thai 3 or more Vehicles in Household Correlation Chart
The statistical analysis conducted on geographies consisting of 475,154,298 people shows a weak negative correlation between the proportion of Thais and percentage of households with 3 or more vehicles available in the United States with a correlation coefficient (R) of -0.222 and weighted average of 19.8%. On average, for every 1% (one percent) increase in Thais within a typical geography, there is a decrease of 0.090% in percentage of households with 3 or more vehicles available.
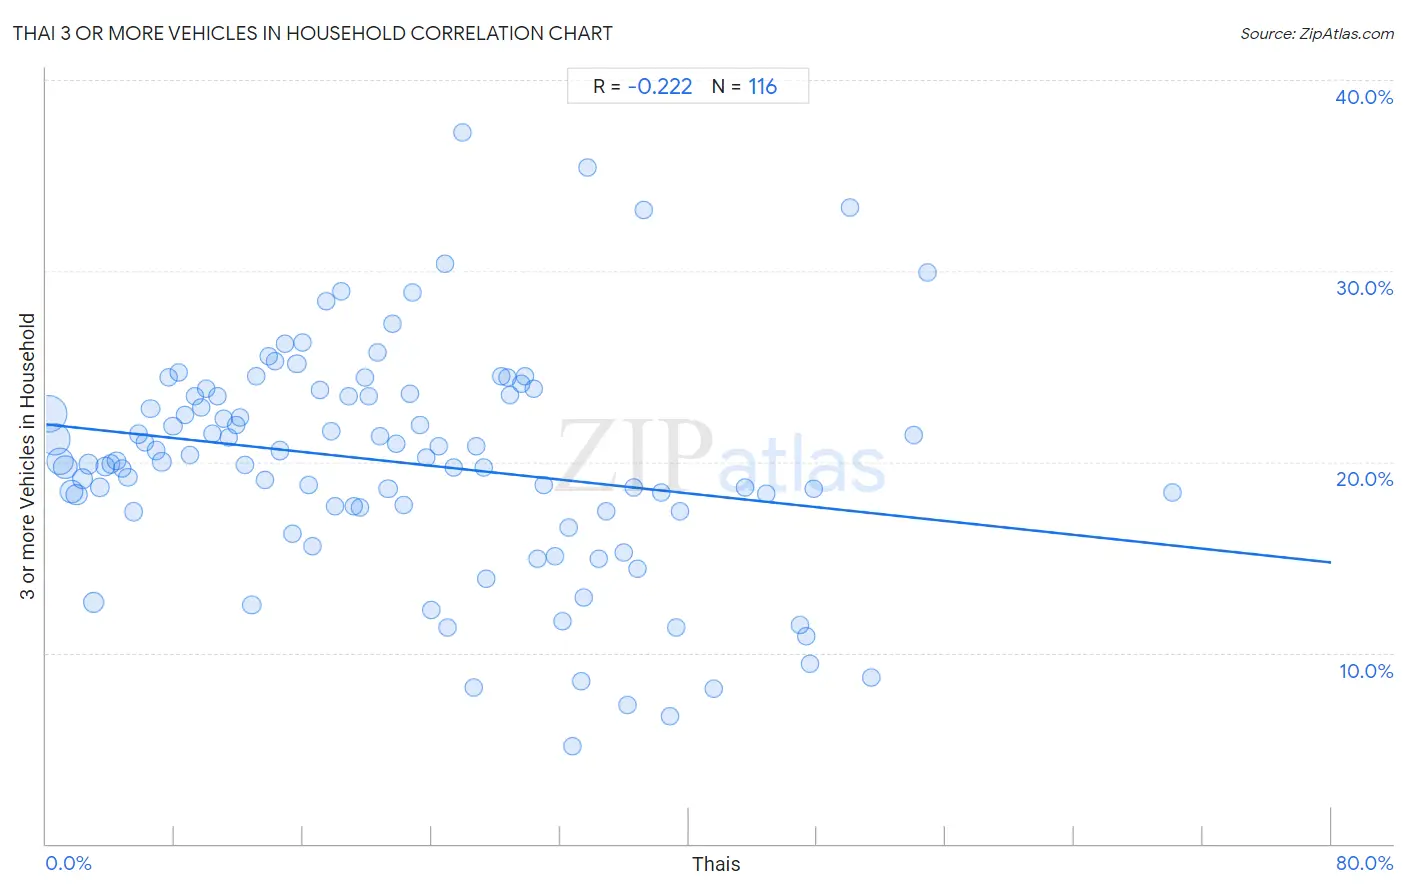
It is essential to understand that the correlation between the percentage of Thais and percentage of households with 3 or more vehicles available does not imply a direct cause-and-effect relationship. It remains uncertain whether the presence of Thais influences an upward or downward trend in the level of percentage of households with 3 or more vehicles available within an area, or if Thais simply ended up residing in those areas with higher or lower levels of percentage of households with 3 or more vehicles available due to other factors.
Demographics Similar to Thais by 3 or more Vehicles in Household
In terms of 3 or more vehicles in household, the demographic groups most similar to Thais are Hungarian (19.8%, a difference of 0.050%), Armenian (19.8%, a difference of 0.20%), Tlingit-Haida (19.9%, a difference of 0.21%), Immigrants from Pakistan (19.8%, a difference of 0.26%), and Immigrants from Lebanon (19.8%, a difference of 0.31%).
| Demographics | Rating | Rank | 3 or more Vehicles in Household |
| Immigrants from Iran | 80.9 /100 | #149 | Excellent 20.0% |
| Immigrants | 80.8 /100 | #150 | Excellent 20.0% |
| Taiwanese | 80.6 /100 | #151 | Excellent 20.0% |
| Lebanese | 79.8 /100 | #152 | Good 20.0% |
| Yuman | 75.6 /100 | #153 | Good 19.9% |
| Immigrants from Jordan | 75.0 /100 | #154 | Good 19.9% |
| Tlingit-Haida | 73.4 /100 | #155 | Good 19.9% |
| Thais | 71.1 /100 | #156 | Good 19.8% |
| Hungarians | 70.5 /100 | #157 | Good 19.8% |
| Armenians | 68.8 /100 | #158 | Good 19.8% |
| Immigrants from Pakistan | 68.2 /100 | #159 | Good 19.8% |
| Immigrants from Lebanon | 67.6 /100 | #160 | Good 19.8% |
| Immigrants from Guatemala | 65.6 /100 | #161 | Good 19.7% |
| Estonians | 63.2 /100 | #162 | Good 19.7% |
| Chileans | 63.0 /100 | #163 | Good 19.7% |
Thai 3 or more Vehicles in Household Correlation Summary
| Measurement | Thai Data | 3 or more Vehicles in Household Data |
| Minimum | 0.16% | 5.1% |
| Maximum | 70.1% | 37.3% |
| Range | 69.9% | 32.2% |
| Mean | 21.9% | 20.0% |
| Median | 20.4% | 20.0% |
| Interquartile 25% (IQ1) | 10.2% | 17.5% |
| Interquartile 75% (IQ3) | 31.9% | 23.5% |
| Interquartile Range (IQR) | 21.7% | 6.0% |
| Standard Deviation (Sample) | 14.5% | 5.9% |
| Standard Deviation (Population) | 14.4% | 5.9% |
Correlation Details
| Thai Percentile | Sample Size | 3 or more Vehicles in Household |
[ 0.0% - 0.5% ] 0.16% | 128,251,292 | 22.5% |
[ 0.5% - 1.0% ] 0.52% | 86,187,869 | 21.2% |
[ 0.5% - 1.0% ] 0.86% | 59,062,295 | 20.0% |
[ 1.0% - 1.5% ] 1.20% | 38,222,134 | 19.7% |
[ 1.5% - 2.0% ] 1.56% | 30,145,745 | 18.4% |
[ 1.5% - 2.0% ] 1.90% | 20,919,174 | 18.3% |
[ 2.0% - 2.5% ] 2.27% | 16,567,170 | 19.1% |
[ 2.5% - 3.0% ] 2.61% | 11,486,988 | 19.9% |
[ 2.5% - 3.0% ] 2.96% | 18,896,723 | 12.7% |
[ 3.0% - 3.5% ] 3.32% | 10,486,634 | 18.6% |
[ 3.5% - 4.0% ] 3.67% | 5,307,029 | 19.7% |
[ 4.0% - 4.5% ] 4.02% | 5,325,628 | 19.9% |
[ 4.0% - 4.5% ] 4.38% | 4,935,871 | 20.0% |
[ 4.5% - 5.0% ] 4.73% | 3,868,118 | 19.7% |
[ 5.0% - 5.5% ] 5.09% | 3,389,258 | 19.2% |
[ 5.0% - 5.5% ] 5.42% | 2,259,474 | 17.4% |
[ 5.5% - 6.0% ] 5.76% | 3,261,246 | 21.5% |
[ 6.0% - 6.5% ] 6.16% | 1,858,169 | 21.0% |
[ 6.0% - 6.5% ] 6.50% | 1,514,717 | 22.8% |
[ 6.5% - 7.0% ] 6.81% | 1,465,241 | 20.6% |
[ 7.0% - 7.5% ] 7.20% | 1,112,897 | 20.0% |
[ 7.5% - 8.0% ] 7.60% | 1,952,070 | 24.4% |
[ 7.5% - 8.0% ] 7.89% | 1,143,212 | 21.9% |
[ 8.0% - 8.5% ] 8.24% | 792,698 | 24.7% |
[ 8.5% - 9.0% ] 8.62% | 863,766 | 22.5% |
[ 8.5% - 9.0% ] 8.98% | 603,427 | 20.3% |
[ 9.0% - 9.5% ] 9.29% | 714,310 | 23.5% |
[ 9.5% - 10.0% ] 9.63% | 695,159 | 22.8% |
[ 9.5% - 10.0% ] 9.95% | 624,916 | 23.9% |
[ 10.0% - 10.5% ] 10.36% | 531,420 | 21.5% |
[ 10.5% - 11.0% ] 10.67% | 537,598 | 23.5% |
[ 11.0% - 11.5% ] 11.07% | 645,469 | 22.2% |
[ 11.0% - 11.5% ] 11.38% | 927,231 | 21.3% |
[ 11.5% - 12.0% ] 11.82% | 180,516 | 21.9% |
[ 12.0% - 12.5% ] 12.07% | 524,499 | 22.3% |
[ 12.0% - 12.5% ] 12.38% | 427,516 | 19.8% |
[ 12.5% - 13.0% ] 12.80% | 843,636 | 12.5% |
[ 13.0% - 13.5% ] 13.11% | 422,803 | 24.5% |
[ 13.5% - 14.0% ] 13.63% | 483,514 | 19.0% |
[ 13.5% - 14.0% ] 13.87% | 299,708 | 25.5% |
[ 14.0% - 14.5% ] 14.23% | 373,447 | 25.3% |
[ 14.5% - 15.0% ] 14.56% | 678,696 | 20.6% |
[ 14.5% - 15.0% ] 14.89% | 213,574 | 26.2% |
[ 15.0% - 15.5% ] 15.35% | 394,649 | 16.2% |
[ 15.5% - 16.0% ] 15.60% | 235,822 | 25.1% |
[ 15.5% - 16.0% ] 15.96% | 144,954 | 26.3% |
[ 16.0% - 16.5% ] 16.34% | 95,398 | 18.8% |
[ 16.5% - 17.0% ] 16.61% | 210,115 | 15.6% |
[ 17.0% - 17.5% ] 17.02% | 78,602 | 23.8% |
[ 17.0% - 17.5% ] 17.47% | 34,484 | 28.4% |
[ 17.5% - 18.0% ] 17.72% | 483,550 | 21.6% |
[ 18.0% - 18.5% ] 18.00% | 258,637 | 17.7% |
[ 18.0% - 18.5% ] 18.36% | 95,553 | 29.0% |
[ 18.5% - 19.0% ] 18.82% | 158,081 | 23.5% |
[ 19.0% - 19.5% ] 19.14% | 10,341 | 17.7% |
[ 19.5% - 20.0% ] 19.51% | 332,773 | 17.6% |
[ 19.5% - 20.0% ] 19.85% | 121,376 | 24.4% |
[ 20.0% - 20.5% ] 20.10% | 223,691 | 23.4% |
[ 20.5% - 21.0% ] 20.61% | 85,133 | 25.7% |
[ 20.5% - 21.0% ] 20.81% | 269,353 | 21.3% |
[ 21.0% - 21.5% ] 21.28% | 139,153 | 18.6% |
[ 21.5% - 22.0% ] 21.57% | 97,178 | 27.3% |
[ 21.5% - 22.0% ] 21.83% | 103,197 | 20.9% |
[ 22.0% - 22.5% ] 22.29% | 120,806 | 17.8% |
[ 22.5% - 23.0% ] 22.68% | 208,151 | 23.6% |
[ 22.5% - 23.0% ] 22.84% | 106,155 | 28.9% |
[ 23.0% - 23.5% ] 23.25% | 36,973 | 22.0% |
[ 23.5% - 24.0% ] 23.64% | 101,208 | 20.2% |
[ 23.5% - 24.0% ] 23.95% | 48,552 | 12.3% |
[ 24.0% - 24.5% ] 24.45% | 248,641 | 20.8% |
[ 24.5% - 25.0% ] 24.81% | 8,456 | 30.4% |
[ 25.0% - 25.5% ] 25.01% | 20,651 | 11.3% |
[ 25.0% - 25.5% ] 25.35% | 30,207 | 19.7% |
[ 25.5% - 26.0% ] 25.88% | 653 | 37.3% |
[ 26.5% - 27.0% ] 26.61% | 27,571 | 8.2% |
[ 26.5% - 27.0% ] 26.78% | 114,355 | 20.8% |
[ 27.0% - 27.5% ] 27.23% | 188,552 | 19.7% |
[ 27.0% - 27.5% ] 27.38% | 22,852 | 13.9% |
[ 28.0% - 28.5% ] 28.34% | 18,949 | 24.5% |
[ 28.5% - 29.0% ] 28.70% | 69,659 | 24.4% |
[ 28.5% - 29.0% ] 28.87% | 95,566 | 23.5% |
[ 29.5% - 30.0% ] 29.55% | 63,620 | 24.1% |
[ 29.5% - 30.0% ] 29.83% | 257,729 | 24.5% |
[ 30.0% - 30.5% ] 30.38% | 76,857 | 23.8% |
[ 30.5% - 31.0% ] 30.61% | 51,153 | 15.0% |
[ 30.5% - 31.0% ] 30.99% | 102,097 | 18.8% |
[ 31.5% - 32.0% ] 31.68% | 30,392 | 15.1% |
[ 32.0% - 32.5% ] 32.12% | 3,695 | 11.7% |
[ 32.5% - 33.0% ] 32.52% | 61,363 | 16.6% |
[ 32.5% - 33.0% ] 32.75% | 2,766 | 5.1% |
[ 33.0% - 33.5% ] 33.28% | 5,018 | 8.5% |
[ 33.0% - 33.5% ] 33.44% | 21,806 | 12.9% |
[ 33.5% - 34.0% ] 33.67% | 802 | 35.4% |
[ 34.0% - 34.5% ] 34.38% | 15,702 | 14.9% |
[ 34.5% - 35.0% ] 34.86% | 68,587 | 17.4% |
[ 35.5% - 36.0% ] 35.98% | 29,756 | 15.3% |
[ 36.0% - 36.5% ] 36.21% | 2,994 | 7.3% |
[ 36.5% - 37.0% ] 36.59% | 20,954 | 18.7% |
[ 36.5% - 37.0% ] 36.84% | 1,425 | 14.4% |
[ 37.0% - 37.5% ] 37.20% | 53,464 | 33.2% |
[ 38.0% - 38.5% ] 38.27% | 23,274 | 18.4% |
[ 38.5% - 39.0% ] 38.87% | 2,560 | 6.7% |
[ 39.0% - 39.5% ] 39.23% | 6,773 | 11.3% |
[ 39.0% - 39.5% ] 39.42% | 104 | 17.4% |
[ 41.5% - 42.0% ] 41.53% | 118 | 8.1% |
[ 43.0% - 43.5% ] 43.50% | 9,750 | 18.7% |
[ 44.5% - 45.0% ] 44.79% | 53,744 | 18.3% |
[ 46.5% - 47.0% ] 46.92% | 21,452 | 11.5% |
[ 47.0% - 47.5% ] 47.30% | 20,693 | 10.8% |
[ 47.5% - 48.0% ] 47.55% | 44,570 | 9.4% |
[ 47.5% - 48.0% ] 47.76% | 10,514 | 18.6% |
[ 50.0% - 50.5% ] 50.00% | 8 | 33.3% |
[ 51.0% - 51.5% ] 51.35% | 2,300 | 8.7% |
[ 53.5% - 54.0% ] 53.99% | 40,614 | 21.4% |
[ 54.5% - 55.0% ] 54.84% | 2,241 | 29.9% |
[ 70.0% - 70.5% ] 70.11% | 2,549 | 18.4% |