Swedish Self-Care Disability
COMPARE
Swedish
Select to Compare
Self-Care Disability
Swedish Self-Care Disability
2.3%
SELF-CARE DISABILITY
99.3/ 100
METRIC RATING
64th/ 347
METRIC RANK
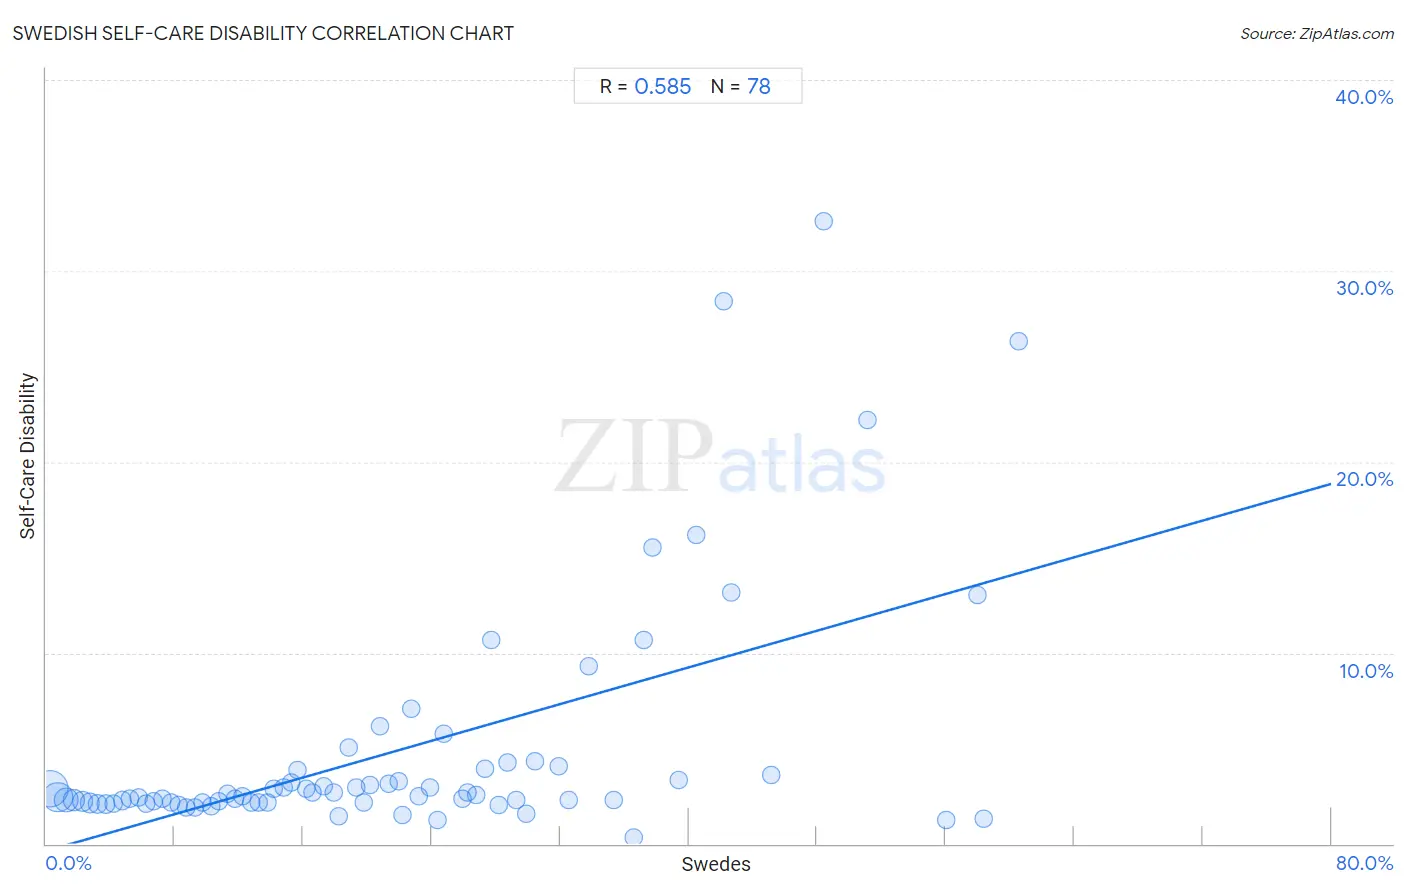
Swedish Self-Care Disability Correlation Chart
The statistical analysis conducted on geographies consisting of 537,435,418 people shows a substantial positive correlation between the proportion of Swedes and percentage of population with self-care disability in the United States with a correlation coefficient (R) of 0.585 and weighted average of 2.3%. On average, for every 1% (one percent) increase in Swedes within a typical geography, there is an increase of 0.24% in percentage of population with self-care disability.
It is essential to understand that the correlation between the percentage of Swedes and percentage of population with self-care disability does not imply a direct cause-and-effect relationship. It remains uncertain whether the presence of Swedes influences an upward or downward trend in the level of percentage of population with self-care disability within an area, or if Swedes simply ended up residing in those areas with higher or lower levels of percentage of population with self-care disability due to other factors.
Demographics Similar to Swedes by Self-Care Disability
In terms of self-care disability, the demographic groups most similar to Swedes are Mongolian (2.3%, a difference of 0.010%), Brazilian (2.3%, a difference of 0.060%), Egyptian (2.3%, a difference of 0.090%), Immigrants from Argentina (2.3%, a difference of 0.090%), and South African (2.3%, a difference of 0.12%).
| Demographics | Rating | Rank | Self-Care Disability |
| Immigrants from Belgium | 99.6 /100 | #57 | Exceptional 2.3% |
| Immigrants from Cameroon | 99.6 /100 | #58 | Exceptional 2.3% |
| New Zealanders | 99.5 /100 | #59 | Exceptional 2.3% |
| Immigrants from Japan | 99.5 /100 | #60 | Exceptional 2.3% |
| Palestinians | 99.4 /100 | #61 | Exceptional 2.3% |
| Egyptians | 99.4 /100 | #62 | Exceptional 2.3% |
| Mongolians | 99.3 /100 | #63 | Exceptional 2.3% |
| Swedes | 99.3 /100 | #64 | Exceptional 2.3% |
| Brazilians | 99.3 /100 | #65 | Exceptional 2.3% |
| Immigrants from Argentina | 99.3 /100 | #66 | Exceptional 2.3% |
| South Africans | 99.3 /100 | #67 | Exceptional 2.3% |
| Immigrants from Zaire | 99.2 /100 | #68 | Exceptional 2.3% |
| Immigrants from Norway | 99.2 /100 | #69 | Exceptional 2.3% |
| Immigrants from Northern Europe | 99.2 /100 | #70 | Exceptional 2.3% |
| Asians | 99.2 /100 | #71 | Exceptional 2.3% |
Swedish Self-Care Disability Correlation Summary
| Measurement | Swedish Data | Self-Care Disability Data |
| Minimum | 0.26% | 0.30% |
| Maximum | 60.5% | 32.6% |
| Range | 60.3% | 32.3% |
| Mean | 21.7% | 4.8% |
| Median | 19.5% | 2.5% |
| Interquartile 25% (IQ1) | 9.7% | 2.1% |
| Interquartile 75% (IQ3) | 29.9% | 3.9% |
| Interquartile Range (IQR) | 20.2% | 1.7% |
| Standard Deviation (Sample) | 15.1% | 6.2% |
| Standard Deviation (Population) | 15.0% | 6.2% |
Correlation Details
| Swedish Percentile | Sample Size | Self-Care Disability |
[ 0.0% - 0.5% ] 0.26% | 211,309,924 | 2.9% |
[ 0.5% - 1.0% ] 0.73% | 134,157,542 | 2.4% |
[ 1.0% - 1.5% ] 1.22% | 71,149,368 | 2.3% |
[ 1.5% - 2.0% ] 1.73% | 39,691,341 | 2.3% |
[ 2.0% - 2.5% ] 2.23% | 26,010,295 | 2.2% |
[ 2.5% - 3.0% ] 2.72% | 17,949,920 | 2.1% |
[ 3.0% - 3.5% ] 3.23% | 10,651,340 | 2.1% |
[ 3.5% - 4.0% ] 3.72% | 7,198,927 | 2.1% |
[ 4.0% - 4.5% ] 4.22% | 3,592,360 | 2.1% |
[ 4.5% - 5.0% ] 4.76% | 2,494,247 | 2.3% |
[ 5.0% - 5.5% ] 5.20% | 2,198,773 | 2.4% |
[ 5.5% - 6.0% ] 5.77% | 1,672,570 | 2.4% |
[ 6.0% - 6.5% ] 6.22% | 2,010,983 | 2.1% |
[ 6.5% - 7.0% ] 6.71% | 1,219,790 | 2.2% |
[ 7.0% - 7.5% ] 7.24% | 911,379 | 2.3% |
[ 7.5% - 8.0% ] 7.77% | 1,121,771 | 2.1% |
[ 8.0% - 8.5% ] 8.22% | 720,944 | 2.0% |
[ 8.5% - 9.0% ] 8.75% | 602,988 | 1.9% |
[ 9.0% - 9.5% ] 9.22% | 537,692 | 1.9% |
[ 9.5% - 10.0% ] 9.72% | 520,518 | 2.2% |
[ 10.0% - 10.5% ] 10.28% | 298,360 | 2.0% |
[ 10.5% - 11.0% ] 10.71% | 162,547 | 2.2% |
[ 11.0% - 11.5% ] 11.25% | 221,115 | 2.6% |
[ 11.5% - 12.0% ] 11.77% | 98,769 | 2.4% |
[ 12.0% - 12.5% ] 12.25% | 138,414 | 2.5% |
[ 12.5% - 13.0% ] 12.74% | 145,809 | 2.1% |
[ 13.0% - 13.5% ] 13.21% | 135,450 | 2.2% |
[ 13.5% - 14.0% ] 13.77% | 88,414 | 2.1% |
[ 14.0% - 14.5% ] 14.18% | 47,275 | 2.9% |
[ 14.5% - 15.0% ] 14.77% | 55,264 | 2.9% |
[ 15.0% - 15.5% ] 15.27% | 57,379 | 3.2% |
[ 15.5% - 16.0% ] 15.67% | 25,547 | 3.9% |
[ 16.0% - 16.5% ] 16.17% | 36,942 | 2.9% |
[ 16.5% - 17.0% ] 16.59% | 42,543 | 2.7% |
[ 17.0% - 17.5% ] 17.31% | 17,803 | 3.0% |
[ 17.5% - 18.0% ] 17.87% | 26,089 | 2.7% |
[ 18.0% - 18.5% ] 18.22% | 9,337 | 1.5% |
[ 18.5% - 19.0% ] 18.81% | 2,871 | 5.1% |
[ 19.0% - 19.5% ] 19.30% | 14,870 | 2.9% |
[ 19.5% - 20.0% ] 19.77% | 13,421 | 2.2% |
[ 20.0% - 20.5% ] 20.17% | 15,582 | 3.1% |
[ 20.5% - 21.0% ] 20.78% | 4,100 | 6.1% |
[ 21.0% - 21.5% ] 21.32% | 2,181 | 3.1% |
[ 21.5% - 22.0% ] 21.95% | 3,426 | 3.3% |
[ 22.0% - 22.5% ] 22.17% | 1,849 | 1.5% |
[ 22.5% - 23.0% ] 22.74% | 4,023 | 7.1% |
[ 23.0% - 23.5% ] 23.16% | 6,033 | 2.5% |
[ 23.5% - 24.0% ] 23.91% | 2,560 | 2.9% |
[ 24.0% - 24.5% ] 24.33% | 3,560 | 1.2% |
[ 24.5% - 25.0% ] 24.76% | 4,414 | 5.8% |
[ 25.5% - 26.0% ] 25.95% | 3,542 | 2.4% |
[ 26.0% - 26.5% ] 26.19% | 2,482 | 2.7% |
[ 26.5% - 27.0% ] 26.78% | 1,878 | 2.5% |
[ 27.0% - 27.5% ] 27.35% | 2,534 | 3.9% |
[ 27.5% - 28.0% ] 27.73% | 1,619 | 10.7% |
[ 28.0% - 28.5% ] 28.17% | 1,608 | 2.0% |
[ 28.5% - 29.0% ] 28.75% | 1,986 | 4.3% |
[ 29.0% - 29.5% ] 29.25% | 653 | 2.3% |
[ 29.5% - 30.0% ] 29.89% | 2,583 | 1.6% |
[ 30.0% - 30.5% ] 30.43% | 23 | 4.3% |
[ 31.5% - 32.0% ] 31.89% | 1,201 | 4.1% |
[ 32.5% - 33.0% ] 32.52% | 1,891 | 2.3% |
[ 33.5% - 34.0% ] 33.77% | 302 | 9.3% |
[ 35.0% - 35.5% ] 35.29% | 187 | 2.3% |
[ 36.5% - 37.0% ] 36.54% | 353 | 0.30% |
[ 37.0% - 37.5% ] 37.21% | 430 | 10.7% |
[ 37.5% - 38.0% ] 37.75% | 408 | 15.5% |
[ 39.0% - 39.5% ] 39.37% | 127 | 3.4% |
[ 40.0% - 40.5% ] 40.46% | 393 | 16.2% |
[ 42.0% - 42.5% ] 42.19% | 429 | 28.4% |
[ 42.5% - 43.0% ] 42.63% | 190 | 13.2% |
[ 45.0% - 45.5% ] 45.12% | 297 | 3.6% |
[ 48.0% - 48.5% ] 48.40% | 374 | 32.6% |
[ 51.0% - 51.5% ] 51.11% | 135 | 22.2% |
[ 56.0% - 56.5% ] 56.00% | 400 | 1.3% |
[ 57.5% - 58.0% ] 57.97% | 276 | 13.0% |
[ 58.0% - 58.5% ] 58.33% | 384 | 1.3% |
[ 60.5% - 61.0% ] 60.53% | 114 | 26.3% |