Swedish Disability Age Under 5
COMPARE
Swedish
Select to Compare
Disability Age Under 5
Swedish Disability Age Under 5
1.6%
DISABILITY | AGE UNDER 5
0.0/ 100
METRIC RATING
294th/ 347
METRIC RANK
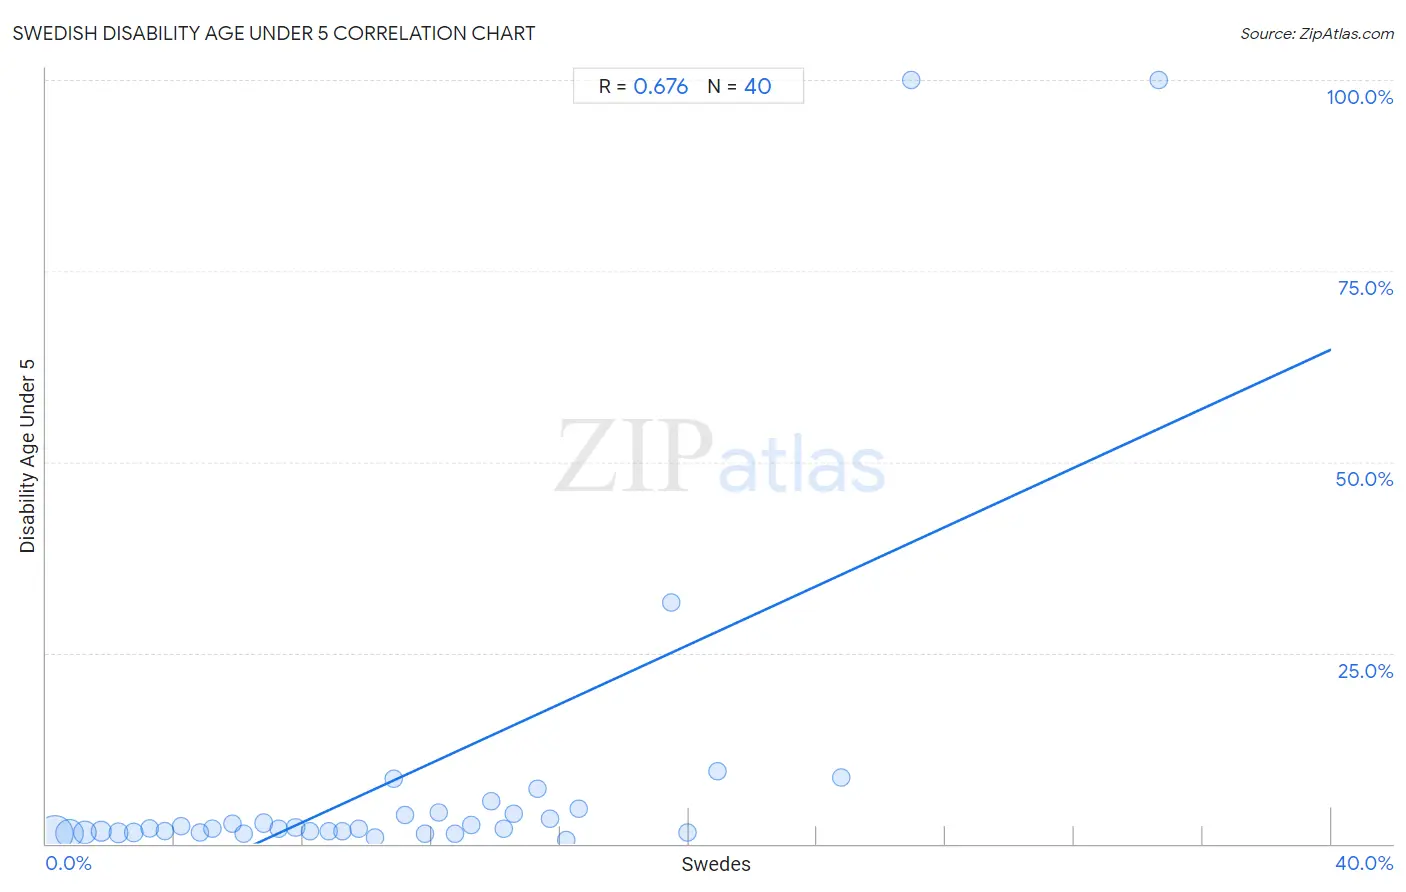
Swedish Disability Age Under 5 Correlation Chart
The statistical analysis conducted on geographies consisting of 252,407,274 people shows a significant positive correlation between the proportion of Swedes and percentage of population with a disability under the age of 5 in the United States with a correlation coefficient (R) of 0.676 and weighted average of 1.6%. On average, for every 1% (one percent) increase in Swedes within a typical geography, there is an increase of 1.9% in percentage of population with a disability under the age of 5.
It is essential to understand that the correlation between the percentage of Swedes and percentage of population with a disability under the age of 5 does not imply a direct cause-and-effect relationship. It remains uncertain whether the presence of Swedes influences an upward or downward trend in the level of percentage of population with a disability under the age of 5 within an area, or if Swedes simply ended up residing in those areas with higher or lower levels of percentage of population with a disability under the age of 5 due to other factors.
Demographics Similar to Swedes by Disability Age Under 5
In terms of disability age under 5, the demographic groups most similar to Swedes are Finnish (1.6%, a difference of 0.62%), Polish (1.6%, a difference of 0.71%), Lithuanian (1.6%, a difference of 1.2%), Italian (1.6%, a difference of 1.7%), and Nonimmigrants (1.6%, a difference of 1.7%).
| Demographics | Rating | Rank | Disability Age Under 5 |
| Scandinavians | 0.0 /100 | #287 | Tragic 1.5% |
| Estonians | 0.0 /100 | #288 | Tragic 1.5% |
| Hungarians | 0.0 /100 | #289 | Tragic 1.5% |
| Czechs | 0.0 /100 | #290 | Tragic 1.5% |
| Northern Europeans | 0.0 /100 | #291 | Tragic 1.6% |
| Italians | 0.0 /100 | #292 | Tragic 1.6% |
| Lithuanians | 0.0 /100 | #293 | Tragic 1.6% |
| Swedes | 0.0 /100 | #294 | Tragic 1.6% |
| Finns | 0.0 /100 | #295 | Tragic 1.6% |
| Poles | 0.0 /100 | #296 | Tragic 1.6% |
| Nonimmigrants | 0.0 /100 | #297 | Tragic 1.6% |
| Cajuns | 0.0 /100 | #298 | Tragic 1.6% |
| Portuguese | 0.0 /100 | #299 | Tragic 1.6% |
| Shoshone | 0.0 /100 | #300 | Tragic 1.6% |
| German Russians | 0.0 /100 | #301 | Tragic 1.6% |
Swedish Disability Age Under 5 Correlation Summary
| Measurement | Swedish Data | Disability Age Under 5 Data |
| Minimum | 0.27% | 0.49% |
| Maximum | 34.6% | 100.0% |
| Range | 34.3% | 99.5% |
| Mean | 10.9% | 8.4% |
| Median | 10.0% | 2.0% |
| Interquartile 25% (IQ1) | 5.0% | 1.5% |
| Interquartile 75% (IQ3) | 14.9% | 4.0% |
| Interquartile Range (IQR) | 9.9% | 2.5% |
| Standard Deviation (Sample) | 7.6% | 21.9% |
| Standard Deviation (Population) | 7.6% | 21.6% |
Correlation Details
| Swedish Percentile | Sample Size | Disability Age Under 5 |
[ 0.0% - 0.5% ] 0.27% | 110,960,041 | 1.4% |
[ 0.5% - 1.0% ] 0.73% | 64,824,986 | 1.4% |
[ 1.0% - 1.5% ] 1.21% | 30,651,513 | 1.5% |
[ 1.5% - 2.0% ] 1.72% | 15,203,217 | 1.6% |
[ 2.0% - 2.5% ] 2.24% | 10,391,959 | 1.4% |
[ 2.5% - 3.0% ] 2.72% | 7,699,349 | 1.4% |
[ 3.0% - 3.5% ] 3.22% | 4,088,502 | 2.0% |
[ 3.5% - 4.0% ] 3.69% | 2,149,941 | 1.6% |
[ 4.0% - 4.5% ] 4.21% | 994,427 | 2.3% |
[ 4.5% - 5.0% ] 4.78% | 797,078 | 1.5% |
[ 5.0% - 5.5% ] 5.18% | 968,385 | 1.9% |
[ 5.5% - 6.0% ] 5.80% | 482,798 | 2.6% |
[ 6.0% - 6.5% ] 6.14% | 788,329 | 1.4% |
[ 6.5% - 7.0% ] 6.76% | 340,090 | 2.7% |
[ 7.0% - 7.5% ] 7.25% | 354,323 | 1.9% |
[ 7.5% - 8.0% ] 7.76% | 299,870 | 2.1% |
[ 8.0% - 8.5% ] 8.23% | 335,753 | 1.6% |
[ 8.5% - 9.0% ] 8.80% | 278,876 | 1.6% |
[ 9.0% - 9.5% ] 9.20% | 218,359 | 1.6% |
[ 9.5% - 10.0% ] 9.73% | 265,037 | 2.0% |
[ 10.0% - 10.5% ] 10.23% | 77,894 | 0.79% |
[ 10.5% - 11.0% ] 10.80% | 8,712 | 8.6% |
[ 11.0% - 11.5% ] 11.16% | 21,485 | 3.7% |
[ 11.5% - 12.0% ] 11.78% | 25,508 | 1.3% |
[ 12.0% - 12.5% ] 12.20% | 46,073 | 4.0% |
[ 12.5% - 13.0% ] 12.72% | 35,055 | 1.4% |
[ 13.0% - 13.5% ] 13.22% | 35,795 | 2.4% |
[ 13.5% - 14.0% ] 13.87% | 17,429 | 5.6% |
[ 14.0% - 14.5% ] 14.23% | 2,692 | 1.9% |
[ 14.5% - 15.0% ] 14.56% | 6,636 | 3.9% |
[ 15.0% - 15.5% ] 15.29% | 1,864 | 7.2% |
[ 15.5% - 16.0% ] 15.67% | 3,643 | 3.2% |
[ 16.0% - 16.5% ] 16.17% | 14,206 | 0.49% |
[ 16.5% - 17.0% ] 16.57% | 11,642 | 4.6% |
[ 19.0% - 19.5% ] 19.45% | 617 | 31.6% |
[ 19.5% - 20.0% ] 19.98% | 1,006 | 1.5% |
[ 20.5% - 21.0% ] 20.88% | 1,983 | 9.4% |
[ 24.5% - 25.0% ] 24.76% | 2,149 | 8.7% |
[ 26.5% - 27.0% ] 26.92% | 26 | 100.0% |
[ 34.5% - 35.0% ] 34.62% | 26 | 100.0% |