Swedish 3 or more Vehicles in Household
COMPARE
Swedish
Select to Compare
3 or more Vehicles in Household
Swedish 3 or more Vehicles in Household
23.0%
3+ VEHICLES AVAILABLE
100.0/ 100
METRIC RATING
37th/ 347
METRIC RANK
Swedish 3 or more Vehicles in Household Correlation Chart
The statistical analysis conducted on geographies consisting of 538,531,467 people shows a moderate positive correlation between the proportion of Swedes and percentage of households with 3 or more vehicles available in the United States with a correlation coefficient (R) of 0.410 and weighted average of 23.0%. On average, for every 1% (one percent) increase in Swedes within a typical geography, there is an increase of 0.31% in percentage of households with 3 or more vehicles available.
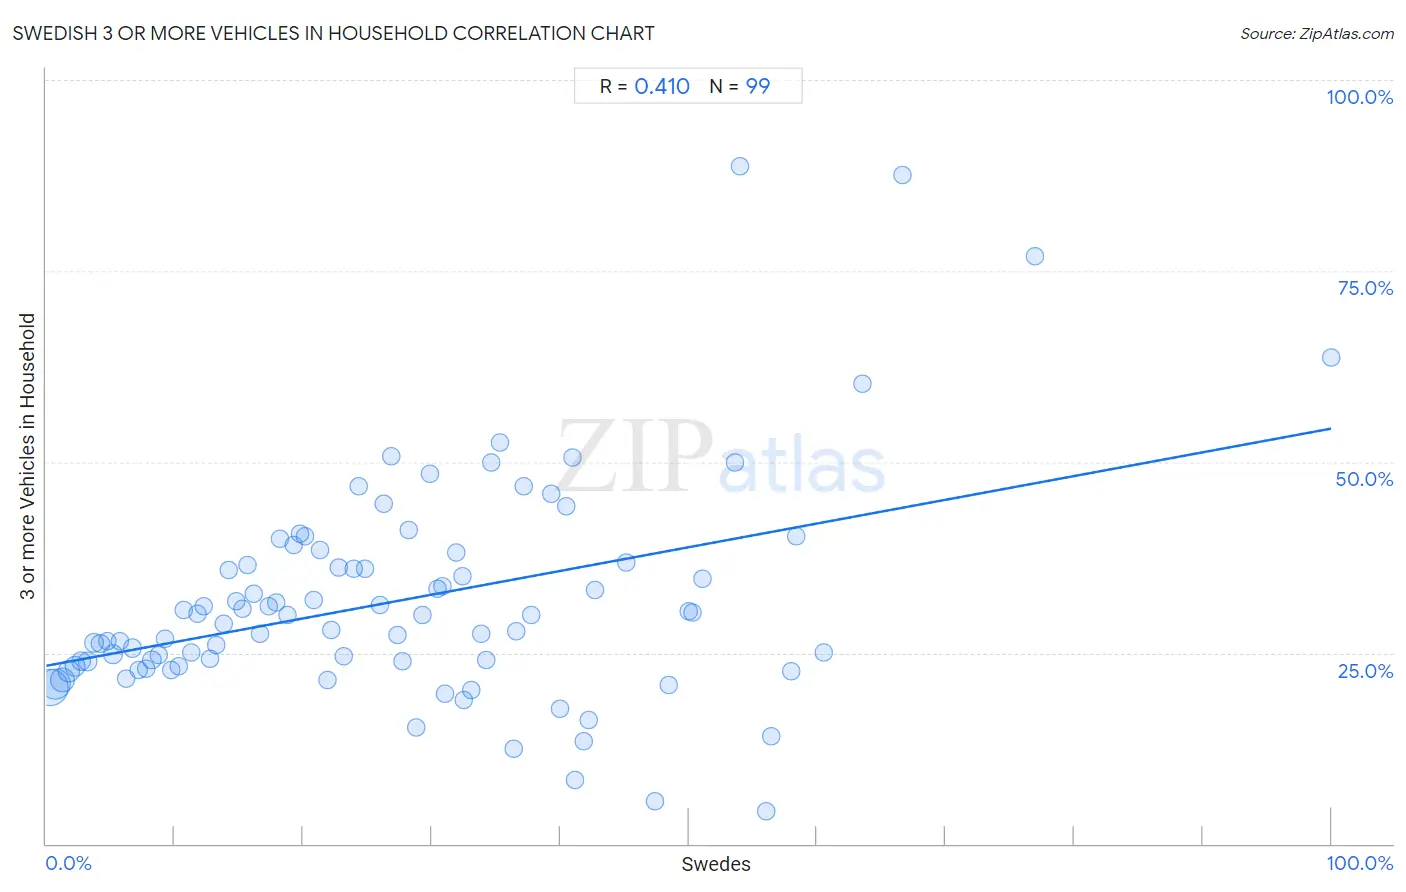
It is essential to understand that the correlation between the percentage of Swedes and percentage of households with 3 or more vehicles available does not imply a direct cause-and-effect relationship. It remains uncertain whether the presence of Swedes influences an upward or downward trend in the level of percentage of households with 3 or more vehicles available within an area, or if Swedes simply ended up residing in those areas with higher or lower levels of percentage of households with 3 or more vehicles available due to other factors.
Demographics Similar to Swedes by 3 or more Vehicles in Household
In terms of 3 or more vehicles in household, the demographic groups most similar to Swedes are Cherokee (23.0%, a difference of 0.030%), Choctaw (23.0%, a difference of 0.070%), Swiss (23.0%, a difference of 0.080%), Spanish American (23.0%, a difference of 0.14%), and Pueblo (23.0%, a difference of 0.20%).
| Demographics | Rating | Rank | 3 or more Vehicles in Household |
| Immigrants from South Eastern Asia | 100.0 /100 | #30 | Exceptional 23.1% |
| English | 100.0 /100 | #31 | Exceptional 23.1% |
| Pueblo | 100.0 /100 | #32 | Exceptional 23.0% |
| Spanish Americans | 100.0 /100 | #33 | Exceptional 23.0% |
| Swiss | 100.0 /100 | #34 | Exceptional 23.0% |
| Choctaw | 100.0 /100 | #35 | Exceptional 23.0% |
| Cherokee | 100.0 /100 | #36 | Exceptional 23.0% |
| Swedes | 100.0 /100 | #37 | Exceptional 23.0% |
| Dutch | 100.0 /100 | #38 | Exceptional 22.9% |
| Yaqui | 100.0 /100 | #39 | Exceptional 22.9% |
| Europeans | 100.0 /100 | #40 | Exceptional 22.9% |
| Germans | 100.0 /100 | #41 | Exceptional 22.7% |
| Natives/Alaskans | 100.0 /100 | #42 | Exceptional 22.7% |
| Osage | 100.0 /100 | #43 | Exceptional 22.7% |
| Cheyenne | 100.0 /100 | #44 | Exceptional 22.7% |
Swedish 3 or more Vehicles in Household Correlation Summary
| Measurement | Swedish Data | 3 or more Vehicles in Household Data |
| Minimum | 0.26% | 4.2% |
| Maximum | 100.0% | 88.7% |
| Range | 99.7% | 84.5% |
| Mean | 27.4% | 31.8% |
| Median | 24.8% | 29.9% |
| Interquartile 25% (IQ1) | 12.2% | 23.3% |
| Interquartile 75% (IQ3) | 39.3% | 36.8% |
| Interquartile Range (IQR) | 27.1% | 13.5% |
| Standard Deviation (Sample) | 19.0% | 14.4% |
| Standard Deviation (Population) | 18.9% | 14.3% |
Correlation Details
| Swedish Percentile | Sample Size | 3 or more Vehicles in Household |
[ 0.0% - 0.5% ] 0.26% | 211,448,739 | 20.4% |
[ 0.5% - 1.0% ] 0.73% | 134,305,982 | 20.9% |
[ 1.0% - 1.5% ] 1.22% | 71,291,189 | 21.4% |
[ 1.5% - 2.0% ] 1.73% | 39,802,386 | 22.5% |
[ 2.0% - 2.5% ] 2.23% | 26,109,084 | 23.3% |
[ 2.5% - 3.0% ] 2.72% | 17,993,187 | 23.9% |
[ 3.0% - 3.5% ] 3.23% | 10,704,319 | 23.9% |
[ 3.5% - 4.0% ] 3.72% | 7,249,485 | 26.3% |
[ 4.0% - 4.5% ] 4.22% | 3,615,250 | 26.2% |
[ 4.5% - 5.0% ] 4.76% | 2,539,543 | 26.6% |
[ 5.0% - 5.5% ] 5.20% | 2,235,688 | 24.8% |
[ 5.5% - 6.0% ] 5.77% | 1,697,730 | 26.6% |
[ 6.0% - 6.5% ] 6.22% | 2,040,020 | 21.6% |
[ 6.5% - 7.0% ] 6.71% | 1,239,686 | 25.6% |
[ 7.0% - 7.5% ] 7.24% | 927,510 | 22.7% |
[ 7.5% - 8.0% ] 7.77% | 1,131,774 | 23.0% |
[ 8.0% - 8.5% ] 8.22% | 728,859 | 24.0% |
[ 8.5% - 9.0% ] 8.75% | 616,046 | 24.7% |
[ 9.0% - 9.5% ] 9.23% | 544,821 | 26.9% |
[ 9.5% - 10.0% ] 9.72% | 528,845 | 22.7% |
[ 10.0% - 10.5% ] 10.28% | 299,250 | 23.3% |
[ 10.5% - 11.0% ] 10.71% | 166,271 | 30.7% |
[ 11.0% - 11.5% ] 11.24% | 228,430 | 25.0% |
[ 11.5% - 12.0% ] 11.77% | 102,541 | 30.0% |
[ 12.0% - 12.5% ] 12.25% | 144,041 | 31.2% |
[ 12.5% - 13.0% ] 12.74% | 149,935 | 24.2% |
[ 13.0% - 13.5% ] 13.21% | 138,891 | 26.1% |
[ 13.5% - 14.0% ] 13.78% | 93,095 | 28.8% |
[ 14.0% - 14.5% ] 14.18% | 51,784 | 35.8% |
[ 14.5% - 15.0% ] 14.77% | 57,190 | 31.7% |
[ 15.0% - 15.5% ] 15.27% | 58,821 | 30.8% |
[ 15.5% - 16.0% ] 15.67% | 26,425 | 36.6% |
[ 16.0% - 16.5% ] 16.18% | 38,551 | 32.8% |
[ 16.5% - 17.0% ] 16.60% | 44,784 | 27.4% |
[ 17.0% - 17.5% ] 17.30% | 19,060 | 31.1% |
[ 17.5% - 18.0% ] 17.85% | 27,729 | 31.6% |
[ 18.0% - 18.5% ] 18.20% | 10,730 | 39.9% |
[ 18.5% - 19.0% ] 18.78% | 5,698 | 29.9% |
[ 19.0% - 19.5% ] 19.31% | 15,487 | 39.2% |
[ 19.5% - 20.0% ] 19.78% | 15,805 | 40.6% |
[ 20.0% - 20.5% ] 20.18% | 16,560 | 40.2% |
[ 20.5% - 21.0% ] 20.78% | 4,894 | 31.9% |
[ 21.0% - 21.5% ] 21.30% | 2,404 | 38.4% |
[ 21.5% - 22.0% ] 21.93% | 4,077 | 21.5% |
[ 22.0% - 22.5% ] 22.19% | 2,307 | 28.0% |
[ 22.5% - 23.0% ] 22.74% | 4,023 | 36.2% |
[ 23.0% - 23.5% ] 23.15% | 5,917 | 24.6% |
[ 23.5% - 24.0% ] 23.91% | 2,673 | 36.0% |
[ 24.0% - 24.5% ] 24.33% | 3,819 | 46.9% |
[ 24.5% - 25.0% ] 24.77% | 4,570 | 36.0% |
[ 25.5% - 26.0% ] 25.93% | 4,257 | 31.2% |
[ 26.0% - 26.5% ] 26.23% | 3,789 | 44.5% |
[ 26.5% - 27.0% ] 26.81% | 2,331 | 50.7% |
[ 27.0% - 27.5% ] 27.35% | 2,600 | 27.4% |
[ 27.5% - 28.0% ] 27.74% | 1,896 | 24.0% |
[ 28.0% - 28.5% ] 28.16% | 1,747 | 41.1% |
[ 28.5% - 29.0% ] 28.80% | 2,882 | 15.2% |
[ 29.0% - 29.5% ] 29.28% | 485 | 30.0% |
[ 29.5% - 30.0% ] 29.86% | 2,880 | 48.4% |
[ 30.0% - 30.5% ] 30.43% | 23 | 33.3% |
[ 30.5% - 31.0% ] 30.80% | 276 | 33.7% |
[ 31.0% - 31.5% ] 31.02% | 332 | 19.7% |
[ 31.5% - 32.0% ] 31.89% | 1,251 | 38.1% |
[ 32.0% - 32.5% ] 32.43% | 370 | 35.0% |
[ 32.5% - 33.0% ] 32.52% | 1,891 | 18.8% |
[ 33.0% - 33.5% ] 33.05% | 118 | 20.2% |
[ 33.5% - 34.0% ] 33.82% | 479 | 27.5% |
[ 34.0% - 34.5% ] 34.21% | 38 | 24.0% |
[ 34.5% - 35.0% ] 34.62% | 26 | 50.0% |
[ 35.0% - 35.5% ] 35.27% | 241 | 52.5% |
[ 36.0% - 36.5% ] 36.36% | 44 | 12.5% |
[ 36.5% - 37.0% ] 36.56% | 372 | 27.9% |
[ 37.0% - 37.5% ] 37.18% | 1,466 | 46.7% |
[ 37.5% - 38.0% ] 37.75% | 347 | 30.0% |
[ 39.0% - 39.5% ] 39.33% | 150 | 45.8% |
[ 40.0% - 40.5% ] 40.00% | 85 | 17.6% |
[ 40.0% - 40.5% ] 40.43% | 507 | 44.1% |
[ 40.5% - 41.0% ] 40.92% | 325 | 50.6% |
[ 41.0% - 41.5% ] 41.18% | 34 | 8.3% |
[ 41.5% - 42.0% ] 41.80% | 122 | 13.5% |
[ 42.0% - 42.5% ] 42.19% | 429 | 16.1% |
[ 42.5% - 43.0% ] 42.69% | 616 | 33.3% |
[ 45.0% - 45.5% ] 45.12% | 461 | 36.8% |
[ 47.0% - 47.5% ] 47.37% | 19 | 5.6% |
[ 48.0% - 48.5% ] 48.40% | 374 | 20.8% |
[ 50.0% - 50.5% ] 50.00% | 178 | 30.4% |
[ 50.0% - 50.5% ] 50.28% | 177 | 30.3% |
[ 51.0% - 51.5% ] 51.11% | 180 | 34.7% |
[ 53.5% - 54.0% ] 53.57% | 28 | 50.0% |
[ 54.0% - 54.5% ] 54.02% | 311 | 88.7% |
[ 56.0% - 56.5% ] 56.00% | 400 | 4.2% |
[ 56.0% - 56.5% ] 56.39% | 133 | 14.1% |
[ 57.5% - 58.0% ] 57.97% | 276 | 22.6% |
[ 58.0% - 58.5% ] 58.33% | 180 | 40.2% |
[ 60.5% - 61.0% ] 60.53% | 114 | 25.0% |
[ 63.5% - 64.0% ] 63.56% | 225 | 60.2% |
[ 66.5% - 67.0% ] 66.67% | 12 | 87.5% |
[ 76.5% - 77.0% ] 76.92% | 52 | 76.9% |
[ 99.5% - 100.0% ] 100.00% | 33 | 63.6% |