Spanish American Indian 2 or more Vehicles in Household

COMPARE

Spanish American Indian
Race
Ancestry
AfghanAfricanAlaska NativeAlaskan AthabascanAlbanianAleutAlsatianAmericanApacheArabArapahoArgentineanArmenianAssyrian/Chaldean/SyriacAustralianAustrianBahamianBangladeshiBarbadianBasqueBelgianBelizeanBermudanBhutaneseBlackfeetBolivianBrazilianBritishBritish West IndianBulgarianBurmeseCajunCambodianCanadianCape VerdeanCarpatho RusynCelticCentral AmericanCentral American IndianCherokeeCheyenneChickasawChileanChineseChippewaChoctawColombianColvilleComancheCosta RicanCreeCreekCroatianCrowCubanCypriotCzechCzechoslovakianDanishDelawareDominicanDutchDutch West IndianEastern EuropeanEcuadorianEgyptianEnglishEstonianEthiopianEuropeanFijianFilipinoFinnishFrenchFrench American IndianFrench CanadianGermanGerman RussianGhanaianGreekGuamanian/ChamorroGuatemalanGuyaneseHaitianHmongHonduranHopiHoumaHungarianIcelanderIndian (Asian)IndonesianInupiatIranianIraqiIrishIroquoisIsraeliItalianJamaicanJapaneseJordanianKenyanKiowaKoreanLaotianLatvianLebaneseLiberianLithuanianLumbeeLuxembourgerMacedonianMalaysianMalteseMarshalleseMenomineeMexicanMexican American IndianMongolianMoroccanNative HawaiianNavajoNepaleseNew ZealanderNicaraguanNigerianNorthern EuropeanNorwegianOkinawanOsageOttawaPaiutePakistaniPalestinianPanamanianParaguayanPennsylvania GermanPeruvianPimaPolishPortuguesePotawatomiPuebloPuerto RicanPuget Sound SalishRomanianRussianSalvadoranSamoanScandinavianScotch-IrishScottishSeminoleSenegaleseSerbianShoshoneSierra LeoneanSiouxSlavicSlovakSloveneSomaliSouth AfricanSouth AmericanSouth American IndianSoviet UnionSpaniardSpanishSpanish AmericanSpanish American IndianSri LankanSubsaharan AfricanSudaneseSwedishSwissSyrianTaiwaneseThaiTlingit-HaidaTohono O'OdhamTonganTrinidadian and TobagonianTsimshianTurkishU.S. Virgin IslanderUgandanUkrainianUruguayanUteVenezuelanVietnameseWelshWest IndianYakamaYaquiYugoslavianYumanYup'ikZimbabwean
Immigration
NonimmigrantsImmigrantsAfghanistanAfricaAlbaniaArgentinaArmeniaAsiaAustraliaAustriaBahamasBangladeshBarbadosBelarusBelgiumBelizeBoliviaBosnia and HerzegovinaBrazilBulgariaBurma/MyanmarCabo VerdeCambodiaCameroonCanadaCaribbeanCentral AmericaChileChinaColombiaCongoCosta RicaCroatiaCubaCzechoslovakiaDenmarkDominicaDominican RepublicEastern AfricaEastern AsiaEastern EuropeEcuadorEgyptEl SalvadorEnglandEritreaEthiopiaEuropeFijiFranceGermanyGhanaGreeceGrenadaGuatemalaGuyanaHaitiHondurasHong KongHungaryIndiaIndonesiaIranIraqIrelandIsraelItalyJamaicaJapanJordanKazakhstanKenyaKoreaKuwaitLaosLatin AmericaLatviaLebanonLiberiaLithuaniaMalaysiaMexicoMicronesiaMiddle AfricaMoldovaMoroccoNepalNetherlandsNicaraguaNigeriaNorth AmericaNorth MacedoniaNorthern AfricaNorthern EuropeNorwayOceaniaPakistanPanamaPeruPhilippinesPolandPortugalRomaniaRussiaSaudi ArabiaScotlandSenegalSerbiaSierra LeoneSingaporeSomaliaSouth AfricaSouth AmericaSouth Central AsiaSouth Eastern AsiaSouthern EuropeSpainSri LankaSt. Vincent and the GrenadinesSudanSwedenSwitzerlandSyriaTaiwanThailandTrinidad and TobagoTurkeyUgandaUkraineUruguayUzbekistanVenezuelaVietnamWest IndiesWestern AfricaWestern AsiaWestern EuropeYemenZaireZimbabweAzores
Select to Compare
Race
Ancestry
AfghanAfricanAlaska NativeAlaskan AthabascanAlbanianAleutAlsatianAmericanApacheArabArapahoArgentineanArmenianAssyrian/Chaldean/SyriacAustralianAustrianBahamianBangladeshiBarbadianBasqueBelgianBelizeanBermudanBhutaneseBlackfeetBolivianBrazilianBritishBritish West IndianBulgarianBurmeseCajunCambodianCanadianCape VerdeanCarpatho RusynCelticCentral AmericanCentral American IndianCherokeeCheyenneChickasawChileanChineseChippewaChoctawColombianColvilleComancheCosta RicanCreeCreekCroatianCrowCubanCypriotCzechCzechoslovakianDanishDelawareDominicanDutchDutch West IndianEastern EuropeanEcuadorianEgyptianEnglishEstonianEthiopianEuropeanFijianFilipinoFinnishFrenchFrench American IndianFrench CanadianGermanGerman RussianGhanaianGreekGuamanian/ChamorroGuatemalanGuyaneseHaitianHmongHonduranHopiHoumaHungarianIcelanderIndian (Asian)IndonesianInupiatIranianIraqiIrishIroquoisIsraeliItalianJamaicanJapaneseJordanianKenyanKiowaKoreanLaotianLatvianLebaneseLiberianLithuanianLumbeeLuxembourgerMacedonianMalaysianMalteseMarshalleseMenomineeMexicanMexican American IndianMongolianMoroccanNative HawaiianNavajoNepaleseNew ZealanderNicaraguanNigerianNorthern EuropeanNorwegianOkinawanOsageOttawaPaiutePakistaniPalestinianPanamanianParaguayanPennsylvania GermanPeruvianPimaPolishPortuguesePotawatomiPuebloPuerto RicanPuget Sound SalishRomanianRussianSalvadoranSamoanScandinavianScotch-IrishScottishSeminoleSenegaleseSerbianShoshoneSierra LeoneanSiouxSlavicSlovakSloveneSomaliSouth AfricanSouth AmericanSouth American IndianSoviet UnionSpaniardSpanishSpanish AmericanSri LankanSubsaharan AfricanSudaneseSwedishSwissSyrianTaiwaneseThaiTlingit-HaidaTohono O'OdhamTonganTrinidadian and TobagonianTsimshianTurkishU.S. Virgin IslanderUgandanUkrainianUruguayanUteVenezuelanVietnameseWelshWest IndianYakamaYaquiYugoslavianYumanYup'ikZimbabwean
Immigration
NonimmigrantsImmigrantsAfghanistanAfricaAlbaniaArgentinaArmeniaAsiaAustraliaAustriaBahamasBangladeshBarbadosBelarusBelgiumBelizeBoliviaBosnia and HerzegovinaBrazilBulgariaBurma/MyanmarCabo VerdeCambodiaCameroonCanadaCaribbeanCentral AmericaChileChinaColombiaCongoCosta RicaCroatiaCubaCzechoslovakiaDenmarkDominicaDominican RepublicEastern AfricaEastern AsiaEastern EuropeEcuadorEgyptEl SalvadorEnglandEritreaEthiopiaEuropeFijiFranceGermanyGhanaGreeceGrenadaGuatemalaGuyanaHaitiHondurasHong KongHungaryIndiaIndonesiaIranIraqIrelandIsraelItalyJamaicaJapanJordanKazakhstanKenyaKoreaKuwaitLaosLatin AmericaLatviaLebanonLiberiaLithuaniaMalaysiaMexicoMicronesiaMiddle AfricaMoldovaMoroccoNepalNetherlandsNicaraguaNigeriaNorth AmericaNorth MacedoniaNorthern AfricaNorthern EuropeNorwayOceaniaPakistanPanamaPeruPhilippinesPolandPortugalRomaniaRussiaSaudi ArabiaScotlandSenegalSerbiaSierra LeoneSingaporeSomaliaSouth AfricaSouth AmericaSouth Central AsiaSouth Eastern AsiaSouthern EuropeSpainSri LankaSt. Vincent and the GrenadinesSudanSwedenSwitzerlandSyriaTaiwanThailandTrinidad and TobagoTurkeyUgandaUkraineUruguayUzbekistanVenezuelaVietnamWest IndiesWestern AfricaWestern AsiaWestern EuropeYemenZaireZimbabweAzores
2 or more Vehicles in Household
Income
Poverty
Unemployment
Labor Participation
Family Structure
Vehicle Availability
Education Level
Disability

Spanish American Indian 2 or more Vehicles in Household
Exceptional

60.3%
2+ VEHICLES AVAILABLE
100.0/ 100
METRIC RATING
31st/ 347
METRIC RANK

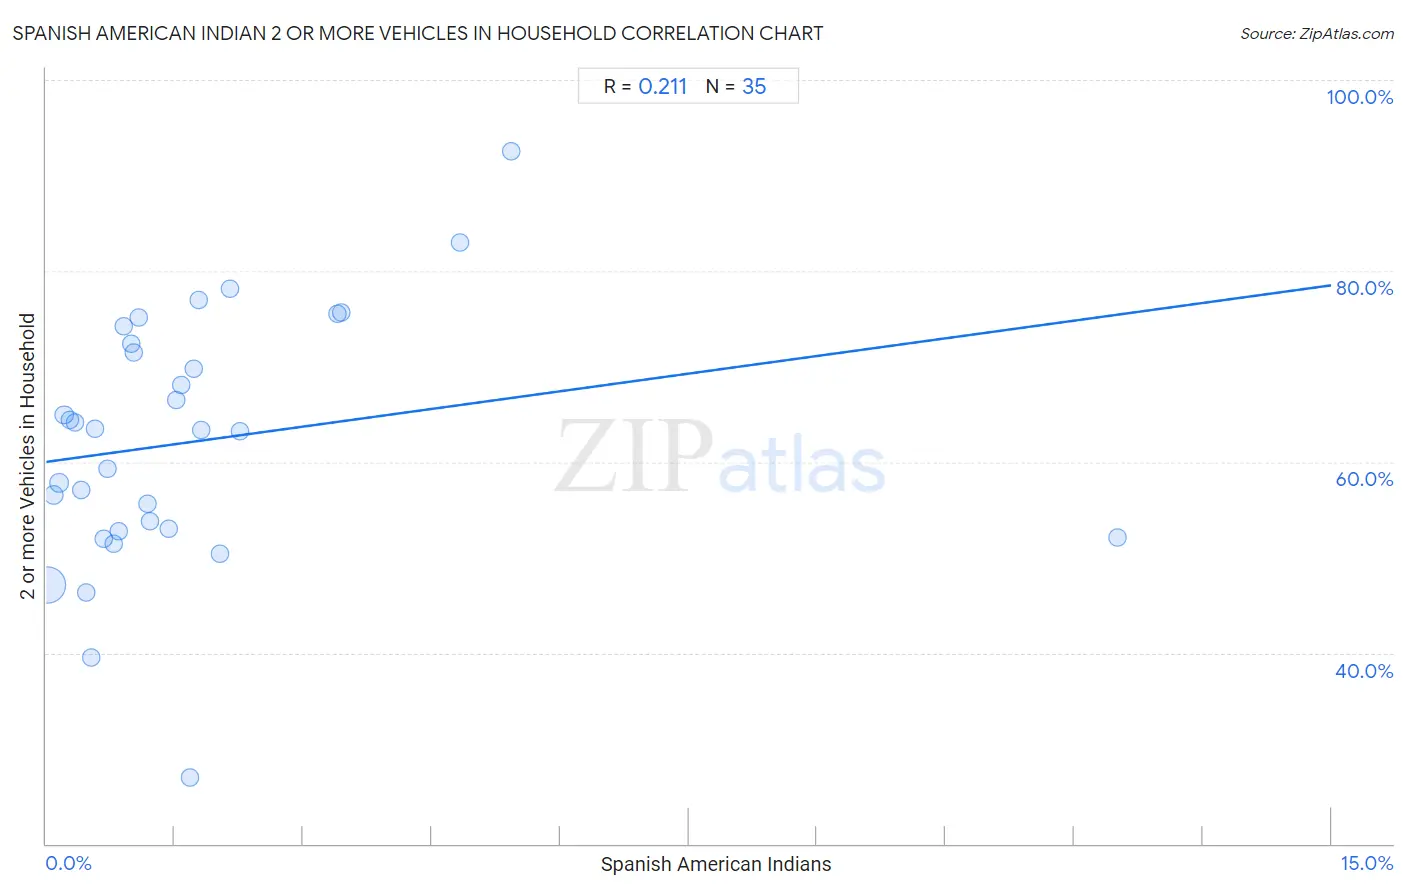
Spanish American Indian 2 or more Vehicles in Household Correlation Chart

The statistical analysis conducted on geographies consisting of 73,145,550 people shows a weak positive correlation between the proportion of Spanish American Indians and percentage of households with 2 or more vehicles available in the United States with a correlation coefficient (R) of 0.211 and weighted average of 60.3%. On average, for every 1% (one percent) increase in Spanish American Indians within a typical geography, there is an increase of 1.2% in percentage of households with 2 or more vehicles available.
Spanish American Indian 2 or more Vehicles in Household
It is essential to understand that the correlation between the percentage of Spanish American Indians and percentage of households with 2 or more vehicles available does not imply a direct cause-and-effect relationship. It remains uncertain whether the presence of Spanish American Indians influences an upward or downward trend in the level of percentage of households with 2 or more vehicles available within an area, or if Spanish American Indians simply ended up residing in those areas with higher or lower levels of percentage of households with 2 or more vehicles available due to other factors.

Demographics Similar to Spanish American Indians by 2 or more Vehicles in Household

In terms of 2 or more vehicles in household, the demographic groups most similar to Spanish American Indians are Finnish (60.3%, a difference of 0.030%), Arapaho (60.2%, a difference of 0.11%), Hawaiian (60.4%, a difference of 0.16%), Immigrants from Mexico (60.2%, a difference of 0.16%), and Spanish (60.2%, a difference of 0.22%).
DemographicsRating | Rank2 or more Vehicles in Household
Immigrants from Vietnam
100.0
/100
|
#24
Exceptional
60.9%
Whites/Caucasians
100.0
/100
|
#25
Exceptional
60.8%
Welsh
100.0
/100
|
#26
Exceptional
60.8%
Assyrians/Chaldeans/Syriacs
100.0
/100
|
#27
Exceptional
60.5%
Guamanians/Chamorros
100.0
/100
|
#28
Exceptional
60.5%
Hawaiians
100.0
/100
|
#29
Exceptional
60.4%
Finns
100.0
/100
|
#30
Exceptional
60.3%
Spanish American Indians
100.0
/100
|
#31
Exceptional
60.3%
Arapaho
100.0
/100
|
#32
Exceptional
60.2%
Immigrants from Mexico
100.0
/100
|
#33
Exceptional
60.2%
Spanish
100.0
/100
|
#34
Exceptional
60.2%
Immigrants from Philippines
100.0
/100
|
#35
Exceptional
60.1%
Chinese
100.0
/100
|
#36
Exceptional
60.1%
Irish
100.0
/100
|
#37
Exceptional
60.1%
Americans
100.0
/100
|
#38
Exceptional
60.0%

Spanish American Indian 2 or more Vehicles in Household Correlation Summary

MeasurementSpanish American Indian Data2 or more Vehicles in Household Data
Minimum0.014%27.0%
Maximum12.5%92.6%
Range12.5%65.6%
Mean1.7%62.1%
Median1.1%63.3%
Interquartile 25% (IQ1)0.52%52.7%
Interquartile 75% (IQ3)1.8%72.3%
Interquartile Range (IQR)1.3%19.7%
Standard Deviation (Sample)2.3%13.2%
Standard Deviation (Population)2.2%13.0%

Correlation Details

Spanish American Indian PercentileSample Size2 or more Vehicles in Household
[
0.0%
-
0.5%
]
0.014%
63,761,33047.1%
[
0.0%
-
0.5%
]
0.089%
4,599,27856.5%
[
0.0%
-
0.5%
]
0.15%
1,730,43557.8%
[
0.0%
-
0.5%
]
0.21%
1,089,40364.9%
[
0.0%
-
0.5%
]
0.28%
702,62264.4%
[
0.0%
-
0.5%
]
0.33%
158,03464.2%
[
0.0%
-
0.5%
]
0.41%
106,62357.1%
[
0.0%
-
0.5%
]
0.47%
145,26646.3%
[
0.5%
-
1.0%
]
0.52%
28,89239.5%
[
0.5%
-
1.0%
]
0.57%
40,02463.4%
[
0.5%
-
1.0%
]
0.66%
10,99151.9%
[
0.5%
-
1.0%
]
0.72%
33,71759.3%
[
0.5%
-
1.0%
]
0.79%
7,43951.5%
[
0.5%
-
1.0%
]
0.84%
51,74952.7%
[
0.5%
-
1.0%
]
0.91%
42,95174.2%
[
0.5%
-
1.0%
]
0.99%
9,26872.3%
[
1.0%
-
1.5%
]
1.02%
21,25071.5%
[
1.0%
-
1.5%
]
1.08%
23,17375.1%
[
1.0%
-
1.5%
]
1.18%
25,59455.7%
[
1.0%
-
1.5%
]
1.22%
2,54653.8%
[
1.0%
-
1.5%
]
1.43%
28053.0%
[
1.5%
-
2.0%
]
1.52%
56,10366.5%
[
1.5%
-
2.0%
]
1.57%
89,02168.1%
[
1.5%
-
2.0%
]
1.68%
7,55427.0%
[
1.5%
-
2.0%
]
1.72%
5,69769.8%
[
1.5%
-
2.0%
]
1.79%
32,86976.9%
[
1.5%
-
2.0%
]
1.81%
108,68263.3%
[
2.0%
-
2.5%
]
2.03%
24650.4%
[
2.0%
-
2.5%
]
2.15%
15,55278.1%
[
2.0%
-
2.5%
]
2.26%
87,08963.2%
[
3.0%
-
3.5%
]
3.40%
72,49575.5%
[
3.0%
-
3.5%
]
3.44%
71,69275.6%
[
4.5%
-
5.0%
]
4.83%
6,83382.9%
[
5.0%
-
5.5%
]
5.43%
70092.6%
[
12.0%
-
12.5%
]
12.50%
15252.1%