Spanish American Indian Self-Care Disability
COMPARE
Spanish American Indian
Select to Compare
Self-Care Disability
Spanish American Indian Self-Care Disability
2.9%
SELF-CARE DISABILITY
0.0/ 100
METRIC RATING
319th/ 347
METRIC RANK
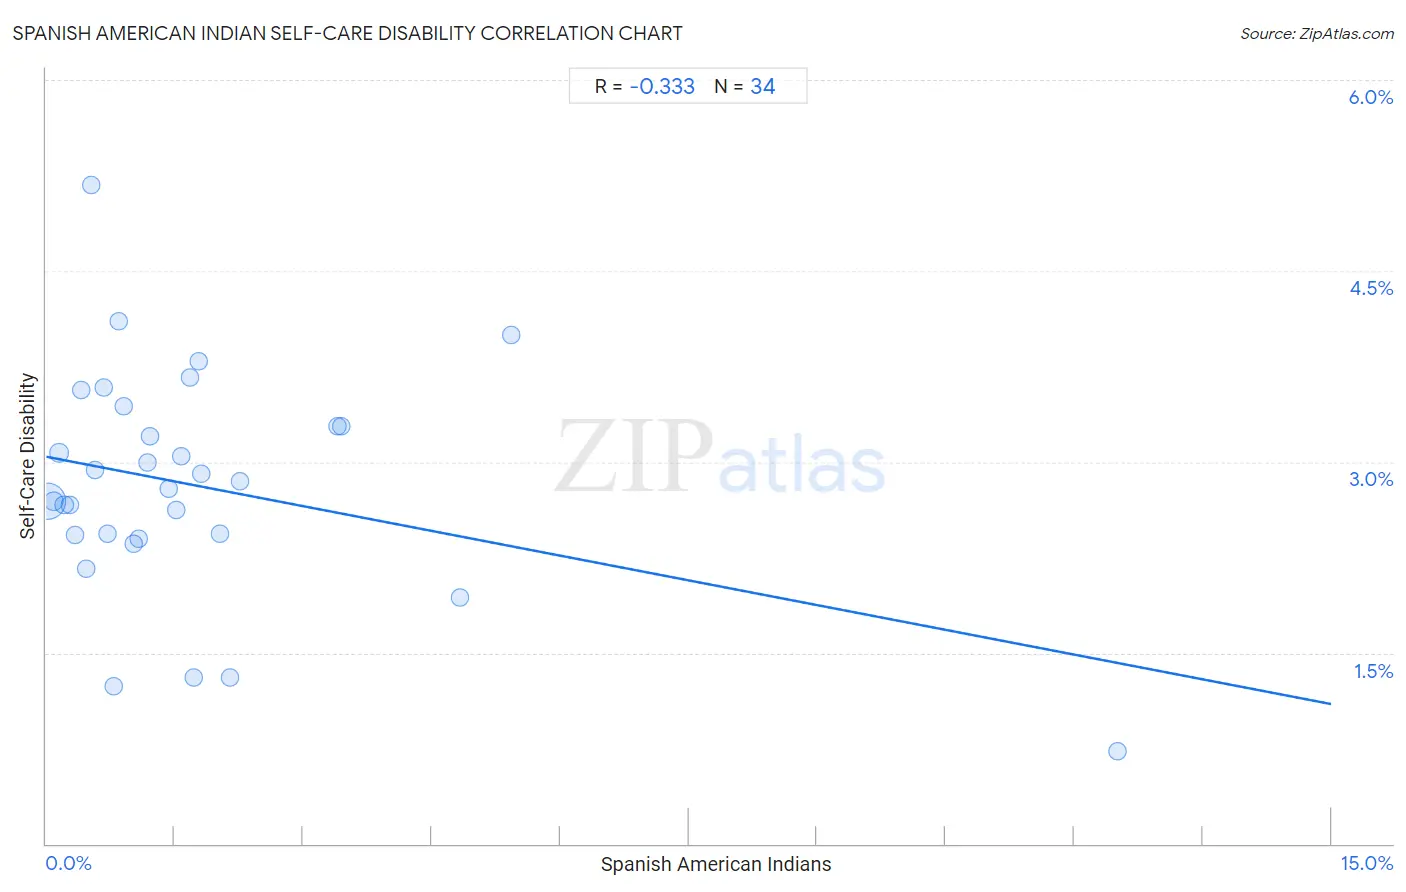
Spanish American Indian Self-Care Disability Correlation Chart
The statistical analysis conducted on geographies consisting of 73,138,430 people shows a mild negative correlation between the proportion of Spanish American Indians and percentage of population with self-care disability in the United States with a correlation coefficient (R) of -0.333 and weighted average of 2.9%. On average, for every 1% (one percent) increase in Spanish American Indians within a typical geography, there is a decrease of 0.13% in percentage of population with self-care disability.
It is essential to understand that the correlation between the percentage of Spanish American Indians and percentage of population with self-care disability does not imply a direct cause-and-effect relationship. It remains uncertain whether the presence of Spanish American Indians influences an upward or downward trend in the level of percentage of population with self-care disability within an area, or if Spanish American Indians simply ended up residing in those areas with higher or lower levels of percentage of population with self-care disability due to other factors.
Demographics Similar to Spanish American Indians by Self-Care Disability
In terms of self-care disability, the demographic groups most similar to Spanish American Indians are Assyrian/Chaldean/Syriac (2.8%, a difference of 0.16%), Immigrants from Dominica (2.8%, a difference of 0.17%), Chickasaw (2.9%, a difference of 0.22%), Menominee (2.8%, a difference of 0.29%), and Navajo (2.9%, a difference of 0.37%).
| Demographics | Rating | Rank | Self-Care Disability |
| Immigrants from Caribbean | 0.0 /100 | #312 | Tragic 2.8% |
| Spanish Americans | 0.0 /100 | #313 | Tragic 2.8% |
| Creek | 0.0 /100 | #314 | Tragic 2.8% |
| Immigrants from Cuba | 0.0 /100 | #315 | Tragic 2.8% |
| Menominee | 0.0 /100 | #316 | Tragic 2.8% |
| Immigrants from Dominica | 0.0 /100 | #317 | Tragic 2.8% |
| Assyrians/Chaldeans/Syriacs | 0.0 /100 | #318 | Tragic 2.8% |
| Spanish American Indians | 0.0 /100 | #319 | Tragic 2.9% |
| Chickasaw | 0.0 /100 | #320 | Tragic 2.9% |
| Navajo | 0.0 /100 | #321 | Tragic 2.9% |
| Comanche | 0.0 /100 | #322 | Tragic 2.9% |
| Seminole | 0.0 /100 | #323 | Tragic 2.9% |
| Cherokee | 0.0 /100 | #324 | Tragic 2.9% |
| Immigrants from Uzbekistan | 0.0 /100 | #325 | Tragic 2.9% |
| Paiute | 0.0 /100 | #326 | Tragic 2.9% |
Spanish American Indian Self-Care Disability Correlation Summary
| Measurement | Spanish American Indian Data | Self-Care Disability Data |
| Minimum | 0.014% | 0.73% |
| Maximum | 12.5% | 5.2% |
| Range | 12.5% | 4.4% |
| Mean | 1.7% | 2.8% |
| Median | 1.1% | 2.8% |
| Interquartile 25% (IQ1) | 0.52% | 2.4% |
| Interquartile 75% (IQ3) | 1.8% | 3.3% |
| Interquartile Range (IQR) | 1.3% | 0.86% |
| Standard Deviation (Sample) | 2.3% | 0.89% |
| Standard Deviation (Population) | 2.3% | 0.88% |
Correlation Details
| Spanish American Indian Percentile | Sample Size | Self-Care Disability |
[ 0.0% - 0.5% ] 0.014% | 63,761,330 | 2.7% |
[ 0.0% - 0.5% ] 0.089% | 4,599,278 | 2.7% |
[ 0.0% - 0.5% ] 0.15% | 1,735,244 | 3.1% |
[ 0.0% - 0.5% ] 0.21% | 1,089,403 | 2.7% |
[ 0.0% - 0.5% ] 0.28% | 702,622 | 2.7% |
[ 0.0% - 0.5% ] 0.33% | 158,034 | 2.4% |
[ 0.0% - 0.5% ] 0.41% | 106,623 | 3.6% |
[ 0.0% - 0.5% ] 0.47% | 145,266 | 2.2% |
[ 0.5% - 1.0% ] 0.52% | 28,892 | 5.2% |
[ 0.5% - 1.0% ] 0.57% | 40,024 | 2.9% |
[ 0.5% - 1.0% ] 0.66% | 10,991 | 3.6% |
[ 0.5% - 1.0% ] 0.72% | 33,717 | 2.4% |
[ 0.5% - 1.0% ] 0.79% | 7,191 | 1.2% |
[ 0.5% - 1.0% ] 0.84% | 49,731 | 4.1% |
[ 0.5% - 1.0% ] 0.91% | 42,951 | 3.4% |
[ 1.0% - 1.5% ] 1.02% | 21,250 | 2.4% |
[ 1.0% - 1.5% ] 1.08% | 23,173 | 2.4% |
[ 1.0% - 1.5% ] 1.18% | 25,594 | 3.0% |
[ 1.0% - 1.5% ] 1.22% | 2,546 | 3.2% |
[ 1.0% - 1.5% ] 1.43% | 280 | 2.8% |
[ 1.5% - 2.0% ] 1.52% | 56,103 | 2.6% |
[ 1.5% - 2.0% ] 1.57% | 89,021 | 3.0% |
[ 1.5% - 2.0% ] 1.68% | 7,554 | 3.7% |
[ 1.5% - 2.0% ] 1.72% | 5,697 | 1.3% |
[ 1.5% - 2.0% ] 1.79% | 32,474 | 3.8% |
[ 1.5% - 2.0% ] 1.81% | 108,682 | 2.9% |
[ 2.0% - 2.5% ] 2.03% | 246 | 2.4% |
[ 2.0% - 2.5% ] 2.15% | 15,552 | 1.3% |
[ 2.0% - 2.5% ] 2.26% | 87,089 | 2.8% |
[ 3.0% - 3.5% ] 3.40% | 72,495 | 3.3% |
[ 3.0% - 3.5% ] 3.44% | 71,692 | 3.3% |
[ 4.5% - 5.0% ] 4.83% | 6,833 | 1.9% |
[ 5.0% - 5.5% ] 5.43% | 700 | 4.0% |
[ 12.0% - 12.5% ] 12.50% | 152 | 0.73% |