Spanish American Indian Wage/Income Gap
COMPARE
Spanish American Indian
Select to Compare
Wage/Income Gap
Spanish American Indian Wage/Income Gap
22.5%
WAGE/INCOME GAP
100.0/ 100
METRIC RATING
64th/ 347
METRIC RANK
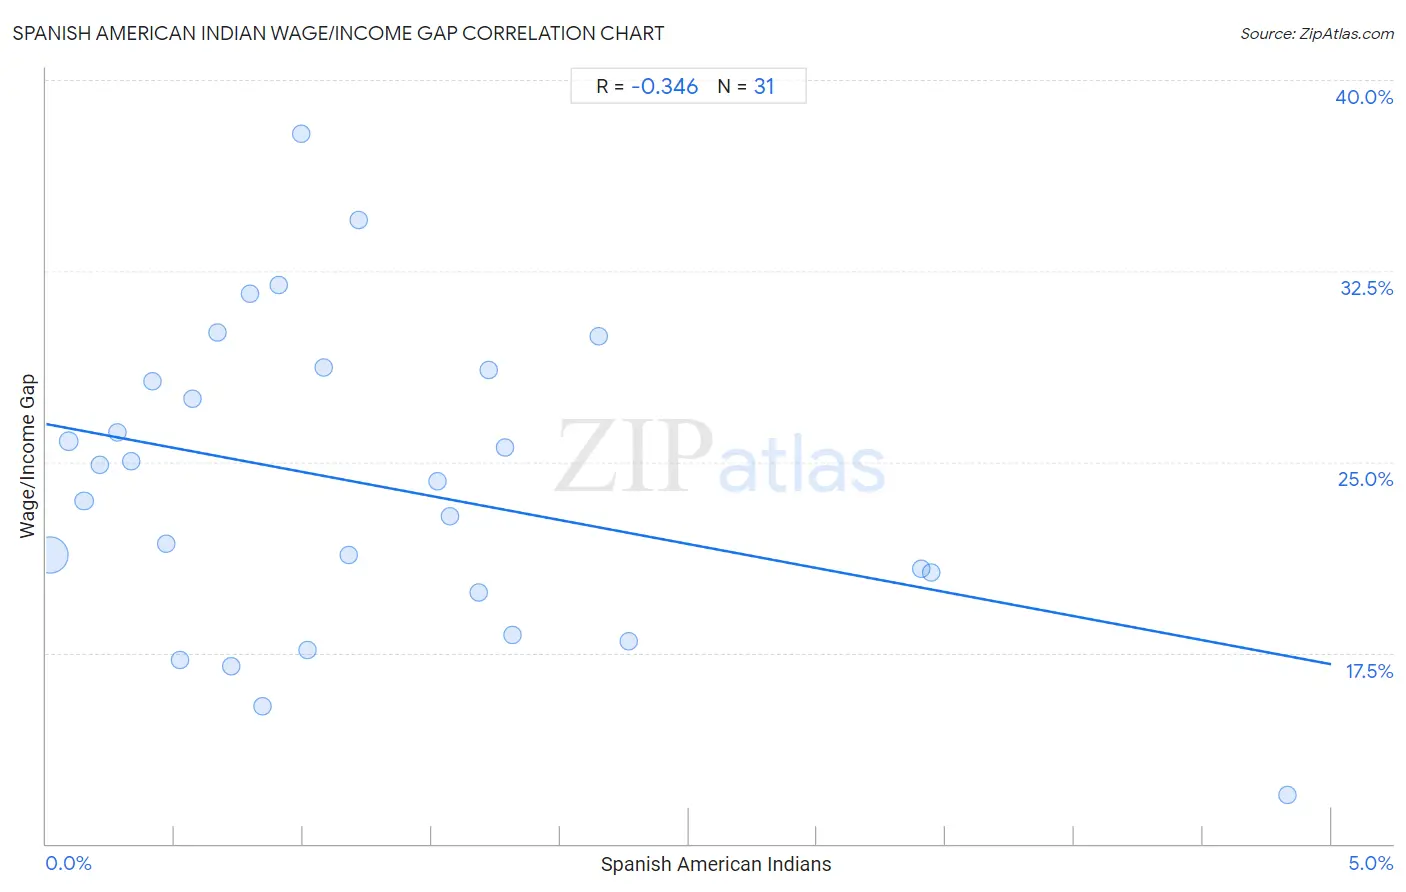
Spanish American Indian Wage/Income Gap Correlation Chart
The statistical analysis conducted on geographies consisting of 73,143,386 people shows a mild negative correlation between the proportion of Spanish American Indians and wage/income gap percentage in the United States with a correlation coefficient (R) of -0.346 and weighted average of 22.5%. On average, for every 1% (one percent) increase in Spanish American Indians within a typical geography, there is a decrease of 1.9% in wage/income gap percentage.
It is essential to understand that the correlation between the percentage of Spanish American Indians and wage/income gap percentage does not imply a direct cause-and-effect relationship. It remains uncertain whether the presence of Spanish American Indians influences an upward or downward trend in the level of wage/income gap percentage within an area, or if Spanish American Indians simply ended up residing in those areas with higher or lower levels of wage/income gap percentage due to other factors.
Demographics Similar to Spanish American Indians by Wage/Income Gap
In terms of wage/income gap, the demographic groups most similar to Spanish American Indians are Immigrants from Ecuador (22.5%, a difference of 0.29%), Guatemalan (22.6%, a difference of 0.32%), Immigrants from Guatemala (22.5%, a difference of 0.43%), Central American Indian (22.7%, a difference of 0.56%), and Immigrants from Fiji (22.4%, a difference of 0.64%).
| Demographics | Rating | Rank | Wage/Income Gap |
| Ghanaians | 100.0 /100 | #57 | Exceptional 22.3% |
| Immigrants from Cuba | 100.0 /100 | #58 | Exceptional 22.4% |
| Navajo | 100.0 /100 | #59 | Exceptional 22.4% |
| Immigrants from Middle Africa | 100.0 /100 | #60 | Exceptional 22.4% |
| Immigrants from Fiji | 100.0 /100 | #61 | Exceptional 22.4% |
| Immigrants from Guatemala | 100.0 /100 | #62 | Exceptional 22.5% |
| Immigrants from Ecuador | 100.0 /100 | #63 | Exceptional 22.5% |
| Spanish American Indians | 100.0 /100 | #64 | Exceptional 22.5% |
| Guatemalans | 99.9 /100 | #65 | Exceptional 22.6% |
| Central American Indians | 99.9 /100 | #66 | Exceptional 22.7% |
| Menominee | 99.9 /100 | #67 | Exceptional 22.7% |
| Immigrants from Nigeria | 99.9 /100 | #68 | Exceptional 22.7% |
| Indonesians | 99.9 /100 | #69 | Exceptional 22.7% |
| Immigrants from Uzbekistan | 99.9 /100 | #70 | Exceptional 22.7% |
| Immigrants from El Salvador | 99.9 /100 | #71 | Exceptional 22.8% |
Spanish American Indian Wage/Income Gap Correlation Summary
| Measurement | Spanish American Indian Data | Wage/Income Gap Data |
| Minimum | 0.014% | 11.9% |
| Maximum | 4.8% | 37.9% |
| Range | 4.8% | 26.0% |
| Mean | 1.2% | 24.1% |
| Median | 0.99% | 24.3% |
| Interquartile 25% (IQ1) | 0.47% | 19.9% |
| Interquartile 75% (IQ3) | 1.7% | 28.6% |
| Interquartile Range (IQR) | 1.3% | 8.8% |
| Standard Deviation (Sample) | 1.1% | 6.0% |
| Standard Deviation (Population) | 1.1% | 5.9% |
Correlation Details
| Spanish American Indian Percentile | Sample Size | Wage/Income Gap |
[ 0.0% - 0.5% ] 0.014% | 63,759,018 | 21.4% |
[ 0.0% - 0.5% ] 0.089% | 4,598,405 | 25.8% |
[ 0.0% - 0.5% ] 0.15% | 1,735,244 | 23.5% |
[ 0.0% - 0.5% ] 0.21% | 1,089,403 | 24.9% |
[ 0.0% - 0.5% ] 0.28% | 702,622 | 26.1% |
[ 0.0% - 0.5% ] 0.33% | 158,034 | 25.0% |
[ 0.0% - 0.5% ] 0.41% | 106,623 | 28.1% |
[ 0.0% - 0.5% ] 0.47% | 145,266 | 21.8% |
[ 0.5% - 1.0% ] 0.52% | 28,500 | 17.2% |
[ 0.5% - 1.0% ] 0.57% | 40,024 | 27.5% |
[ 0.5% - 1.0% ] 0.66% | 10,991 | 30.1% |
[ 0.5% - 1.0% ] 0.72% | 33,717 | 17.0% |
[ 0.5% - 1.0% ] 0.79% | 7,439 | 31.6% |
[ 0.5% - 1.0% ] 0.84% | 49,731 | 15.4% |
[ 0.5% - 1.0% ] 0.91% | 42,951 | 32.0% |
[ 0.5% - 1.0% ] 0.99% | 9,268 | 37.9% |
[ 1.0% - 1.5% ] 1.02% | 21,250 | 17.6% |
[ 1.0% - 1.5% ] 1.08% | 23,173 | 28.7% |
[ 1.0% - 1.5% ] 1.18% | 25,594 | 21.4% |
[ 1.0% - 1.5% ] 1.22% | 2,546 | 34.5% |
[ 1.5% - 2.0% ] 1.52% | 56,103 | 24.3% |
[ 1.5% - 2.0% ] 1.57% | 89,021 | 22.9% |
[ 1.5% - 2.0% ] 1.68% | 7,554 | 19.9% |
[ 1.5% - 2.0% ] 1.72% | 5,697 | 28.6% |
[ 1.5% - 2.0% ] 1.79% | 32,869 | 25.5% |
[ 1.5% - 2.0% ] 1.81% | 108,682 | 18.2% |
[ 2.0% - 2.5% ] 2.15% | 15,552 | 29.9% |
[ 2.0% - 2.5% ] 2.26% | 87,089 | 18.0% |
[ 3.0% - 3.5% ] 3.40% | 72,495 | 20.8% |
[ 3.0% - 3.5% ] 3.44% | 71,692 | 20.7% |
[ 4.5% - 5.0% ] 4.83% | 6,833 | 11.9% |