South American Indian Disability

COMPARE

South American Indian
Race
Ancestry
AfghanAfricanAlaska NativeAlaskan AthabascanAlbanianAleutAlsatianAmericanApacheArabArapahoArgentineanArmenianAssyrian/Chaldean/SyriacAustralianAustrianBahamianBangladeshiBarbadianBasqueBelgianBelizeanBermudanBhutaneseBlackfeetBolivianBrazilianBritishBritish West IndianBulgarianBurmeseCajunCambodianCanadianCape VerdeanCarpatho RusynCelticCentral AmericanCentral American IndianCherokeeCheyenneChickasawChileanChineseChippewaChoctawColombianColvilleComancheCosta RicanCreeCreekCroatianCrowCubanCypriotCzechCzechoslovakianDanishDelawareDominicanDutchDutch West IndianEastern EuropeanEcuadorianEgyptianEnglishEstonianEthiopianEuropeanFijianFilipinoFinnishFrenchFrench American IndianFrench CanadianGermanGerman RussianGhanaianGreekGuamanian/ChamorroGuatemalanGuyaneseHaitianHmongHonduranHopiHoumaHungarianIcelanderIndian (Asian)IndonesianInupiatIranianIraqiIrishIroquoisIsraeliItalianJamaicanJapaneseJordanianKenyanKiowaKoreanLaotianLatvianLebaneseLiberianLithuanianLumbeeLuxembourgerMacedonianMalaysianMalteseMarshalleseMenomineeMexicanMexican American IndianMongolianMoroccanNative HawaiianNavajoNepaleseNew ZealanderNicaraguanNigerianNorthern EuropeanNorwegianOkinawanOsageOttawaPaiutePakistaniPalestinianPanamanianParaguayanPennsylvania GermanPeruvianPimaPolishPortuguesePotawatomiPuebloPuerto RicanPuget Sound SalishRomanianRussianSalvadoranSamoanScandinavianScotch-IrishScottishSeminoleSenegaleseSerbianShoshoneSierra LeoneanSiouxSlavicSlovakSloveneSomaliSouth AfricanSouth AmericanSouth American IndianSoviet UnionSpaniardSpanishSpanish AmericanSpanish American IndianSri LankanSubsaharan AfricanSudaneseSwedishSwissSyrianTaiwaneseThaiTlingit-HaidaTohono O'OdhamTonganTrinidadian and TobagonianTsimshianTurkishU.S. Virgin IslanderUgandanUkrainianUruguayanUteVenezuelanVietnameseWelshWest IndianYakamaYaquiYugoslavianYumanYup'ikZimbabwean
Immigration
NonimmigrantsImmigrantsAfghanistanAfricaAlbaniaArgentinaArmeniaAsiaAustraliaAustriaBahamasBangladeshBarbadosBelarusBelgiumBelizeBoliviaBosnia and HerzegovinaBrazilBulgariaBurma/MyanmarCabo VerdeCambodiaCameroonCanadaCaribbeanCentral AmericaChileChinaColombiaCongoCosta RicaCroatiaCubaCzechoslovakiaDenmarkDominicaDominican RepublicEastern AfricaEastern AsiaEastern EuropeEcuadorEgyptEl SalvadorEnglandEritreaEthiopiaEuropeFijiFranceGermanyGhanaGreeceGrenadaGuatemalaGuyanaHaitiHondurasHong KongHungaryIndiaIndonesiaIranIraqIrelandIsraelItalyJamaicaJapanJordanKazakhstanKenyaKoreaKuwaitLaosLatin AmericaLatviaLebanonLiberiaLithuaniaMalaysiaMexicoMicronesiaMiddle AfricaMoldovaMoroccoNepalNetherlandsNicaraguaNigeriaNorth AmericaNorth MacedoniaNorthern AfricaNorthern EuropeNorwayOceaniaPakistanPanamaPeruPhilippinesPolandPortugalRomaniaRussiaSaudi ArabiaScotlandSenegalSerbiaSierra LeoneSingaporeSomaliaSouth AfricaSouth AmericaSouth Central AsiaSouth Eastern AsiaSouthern EuropeSpainSri LankaSt. Vincent and the GrenadinesSudanSwedenSwitzerlandSyriaTaiwanThailandTrinidad and TobagoTurkeyUgandaUkraineUruguayUzbekistanVenezuelaVietnamWest IndiesWestern AfricaWestern AsiaWestern EuropeYemenZaireZimbabweAzores
Select to Compare
Race
Ancestry
AfghanAfricanAlaska NativeAlaskan AthabascanAlbanianAleutAlsatianAmericanApacheArabArapahoArgentineanArmenianAssyrian/Chaldean/SyriacAustralianAustrianBahamianBangladeshiBarbadianBasqueBelgianBelizeanBermudanBhutaneseBlackfeetBolivianBrazilianBritishBritish West IndianBulgarianBurmeseCajunCambodianCanadianCape VerdeanCarpatho RusynCelticCentral AmericanCentral American IndianCherokeeCheyenneChickasawChileanChineseChippewaChoctawColombianColvilleComancheCosta RicanCreeCreekCroatianCrowCubanCypriotCzechCzechoslovakianDanishDelawareDominicanDutchDutch West IndianEastern EuropeanEcuadorianEgyptianEnglishEstonianEthiopianEuropeanFijianFilipinoFinnishFrenchFrench American IndianFrench CanadianGermanGerman RussianGhanaianGreekGuamanian/ChamorroGuatemalanGuyaneseHaitianHmongHonduranHopiHoumaHungarianIcelanderIndian (Asian)IndonesianInupiatIranianIraqiIrishIroquoisIsraeliItalianJamaicanJapaneseJordanianKenyanKiowaKoreanLaotianLatvianLebaneseLiberianLithuanianLumbeeLuxembourgerMacedonianMalaysianMalteseMarshalleseMenomineeMexicanMexican American IndianMongolianMoroccanNative HawaiianNavajoNepaleseNew ZealanderNicaraguanNigerianNorthern EuropeanNorwegianOkinawanOsageOttawaPaiutePakistaniPalestinianPanamanianParaguayanPennsylvania GermanPeruvianPimaPolishPortuguesePotawatomiPuebloPuerto RicanPuget Sound SalishRomanianRussianSalvadoranSamoanScandinavianScotch-IrishScottishSeminoleSenegaleseSerbianShoshoneSierra LeoneanSiouxSlavicSlovakSloveneSomaliSouth AfricanSouth AmericanSoviet UnionSpaniardSpanishSpanish AmericanSpanish American IndianSri LankanSubsaharan AfricanSudaneseSwedishSwissSyrianTaiwaneseThaiTlingit-HaidaTohono O'OdhamTonganTrinidadian and TobagonianTsimshianTurkishU.S. Virgin IslanderUgandanUkrainianUruguayanUteVenezuelanVietnameseWelshWest IndianYakamaYaquiYugoslavianYumanYup'ikZimbabwean
Immigration
NonimmigrantsImmigrantsAfghanistanAfricaAlbaniaArgentinaArmeniaAsiaAustraliaAustriaBahamasBangladeshBarbadosBelarusBelgiumBelizeBoliviaBosnia and HerzegovinaBrazilBulgariaBurma/MyanmarCabo VerdeCambodiaCameroonCanadaCaribbeanCentral AmericaChileChinaColombiaCongoCosta RicaCroatiaCubaCzechoslovakiaDenmarkDominicaDominican RepublicEastern AfricaEastern AsiaEastern EuropeEcuadorEgyptEl SalvadorEnglandEritreaEthiopiaEuropeFijiFranceGermanyGhanaGreeceGrenadaGuatemalaGuyanaHaitiHondurasHong KongHungaryIndiaIndonesiaIranIraqIrelandIsraelItalyJamaicaJapanJordanKazakhstanKenyaKoreaKuwaitLaosLatin AmericaLatviaLebanonLiberiaLithuaniaMalaysiaMexicoMicronesiaMiddle AfricaMoldovaMoroccoNepalNetherlandsNicaraguaNigeriaNorth AmericaNorth MacedoniaNorthern AfricaNorthern EuropeNorwayOceaniaPakistanPanamaPeruPhilippinesPolandPortugalRomaniaRussiaSaudi ArabiaScotlandSenegalSerbiaSierra LeoneSingaporeSomaliaSouth AfricaSouth AmericaSouth Central AsiaSouth Eastern AsiaSouthern EuropeSpainSri LankaSt. Vincent and the GrenadinesSudanSwedenSwitzerlandSyriaTaiwanThailandTrinidad and TobagoTurkeyUgandaUkraineUruguayUzbekistanVenezuelaVietnamWest IndiesWestern AfricaWestern AsiaWestern EuropeYemenZaireZimbabweAzores
Disability
Income
Poverty
Unemployment
Labor Participation
Family Structure
Vehicle Availability
Education Level
Disability

South American Indian Disability
Exceptional

11.4%
DISABILITY
92.2/ 100
METRIC RATING
124th/ 347
METRIC RANK

South American Indian Disability Correlation Chart

The statistical analysis conducted on geographies consisting of 164,561,915 people shows a weak negative correlation between the proportion of South American Indians and percentage of population with a disability in the United States with a correlation coefficient (R) of -0.216 and weighted average of 11.4%. On average, for every 1% (one percent) increase in South American Indians within a typical geography, there is a decrease of 0.16% in percentage of population with a disability.
South American Indian Disability
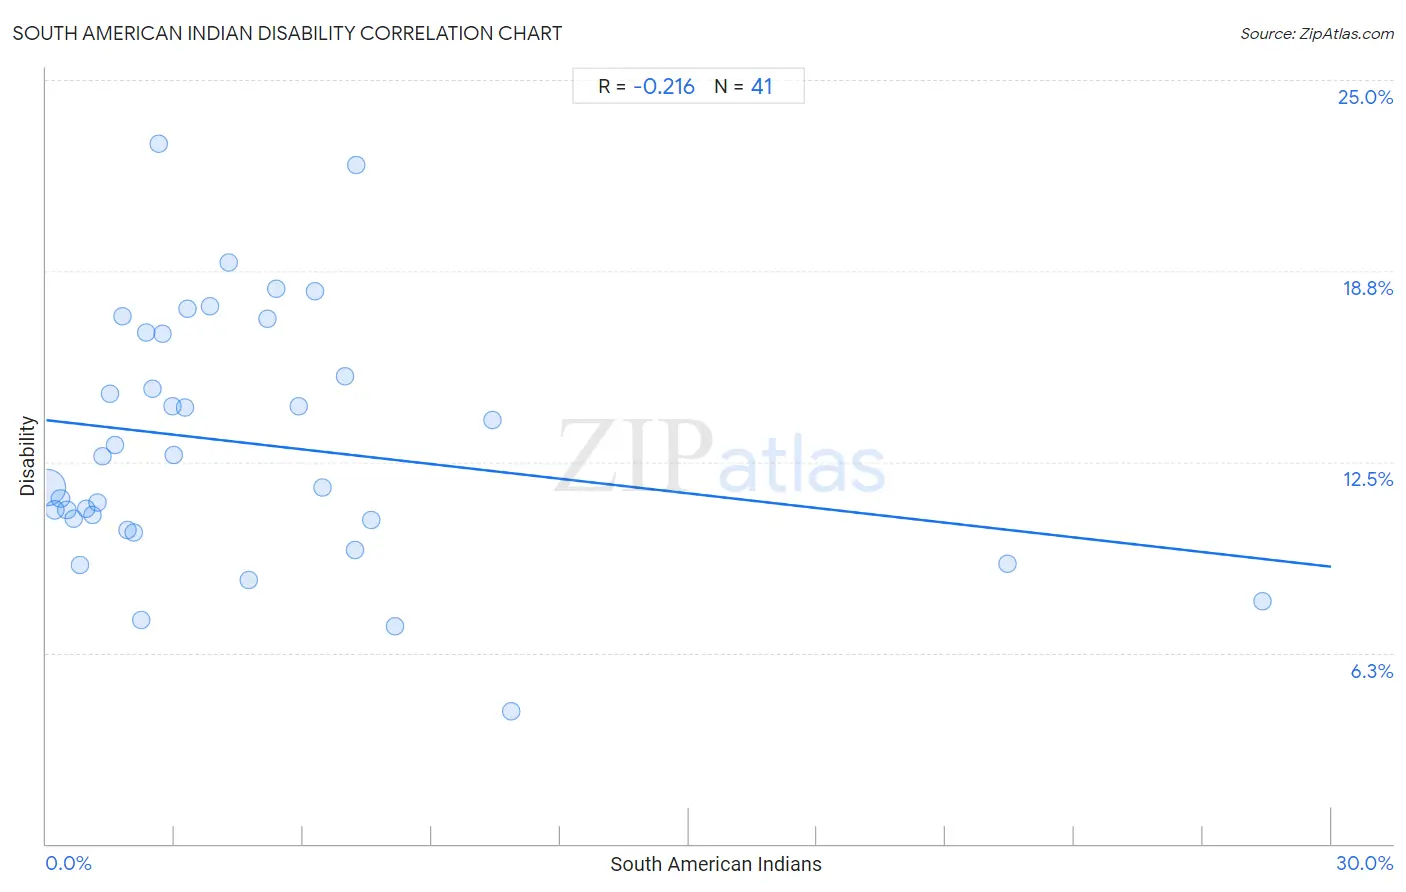
It is essential to understand that the correlation between the percentage of South American Indians and percentage of population with a disability does not imply a direct cause-and-effect relationship. It remains uncertain whether the presence of South American Indians influences an upward or downward trend in the level of percentage of population with a disability within an area, or if South American Indians simply ended up residing in those areas with higher or lower levels of percentage of population with a disability due to other factors.

Demographics Similar to South American Indians by Disability

In terms of disability, the demographic groups most similar to South American Indians are South African (11.4%, a difference of 0.020%), Costa Rican (11.4%, a difference of 0.040%), Brazilian (11.4%, a difference of 0.19%), Immigrants from Latvia (11.4%, a difference of 0.19%), and Immigrants from North Macedonia (11.4%, a difference of 0.22%).
DemographicsRating | RankDisability
Luxembourgers
93.9
/100
|
#117
Exceptional
11.3%
Koreans
93.8
/100
|
#118
Exceptional
11.3%
Central Americans
93.5
/100
|
#119
Exceptional
11.4%
Immigrants from North Macedonia
93.5
/100
|
#120
Exceptional
11.4%
Immigrants from Costa Rica
93.4
/100
|
#121
Exceptional
11.4%
Brazilians
93.3
/100
|
#122
Exceptional
11.4%
South Africans
92.3
/100
|
#123
Exceptional
11.4%
South American Indians
92.2
/100
|
#124
Exceptional
11.4%
Costa Ricans
91.9
/100
|
#125
Exceptional
11.4%
Immigrants from Latvia
90.9
/100
|
#126
Exceptional
11.4%
Immigrants from Italy
90.4
/100
|
#127
Exceptional
11.4%
Immigrants from Europe
90.4
/100
|
#128
Exceptional
11.4%
Macedonians
90.3
/100
|
#129
Exceptional
11.4%
Latvians
89.8
/100
|
#130
Excellent
11.4%
Immigrants from Croatia
89.8
/100
|
#131
Excellent
11.4%

South American Indian Disability Correlation Summary

MeasurementSouth American Indian DataDisability Data
Minimum0.038%4.3%
Maximum28.4%22.9%
Range28.3%18.6%
Mean4.7%13.1%
Median3.0%12.7%
Interquartile 25% (IQ1)1.4%10.4%
Interquartile 75% (IQ3)6.4%16.7%
Interquartile Range (IQR)5.0%6.3%
Standard Deviation (Sample)5.6%4.1%
Standard Deviation (Population)5.5%4.1%

Correlation Details

South American Indian PercentileSample SizeDisability
[
0.0%
-
0.5%
]
0.038%
145,869,75111.6%
[
0.0%
-
0.5%
]
0.20%
12,427,10510.9%
[
0.0%
-
0.5%
]
0.33%
3,281,24211.3%
[
0.0%
-
0.5%
]
0.48%
1,021,70810.9%
[
0.5%
-
1.0%
]
0.63%
857,38810.6%
[
0.5%
-
1.0%
]
0.78%
365,3229.1%
[
0.5%
-
1.0%
]
0.93%
111,67410.9%
[
1.0%
-
1.5%
]
1.07%
207,68810.7%
[
1.0%
-
1.5%
]
1.19%
106,66711.2%
[
1.0%
-
1.5%
]
1.32%
122,59612.7%
[
1.0%
-
1.5%
]
1.48%
34,88714.7%
[
1.5%
-
2.0%
]
1.61%
19,88813.0%
[
1.5%
-
2.0%
]
1.77%
23,02817.3%
[
1.5%
-
2.0%
]
1.90%
11,60110.3%
[
2.0%
-
2.5%
]
2.05%
3,11810.2%
[
2.0%
-
2.5%
]
2.22%
34,7987.3%
[
2.0%
-
2.5%
]
2.33%
1,59016.7%
[
2.0%
-
2.5%
]
2.48%
12114.9%
[
2.5%
-
3.0%
]
2.63%
1,67622.9%
[
2.5%
-
3.0%
]
2.72%
15,89316.7%
[
2.5%
-
3.0%
]
2.95%
6,29914.3%
[
2.5%
-
3.0%
]
2.99%
1,17212.7%
[
3.0%
-
3.5%
]
3.23%
13,11114.3%
[
3.0%
-
3.5%
]
3.29%
1,03517.5%
[
3.5%
-
4.0%
]
3.84%
3,88317.6%
[
4.0%
-
4.5%
]
4.25%
72919.0%
[
4.5%
-
5.0%
]
4.74%
2,8298.6%
[
5.0%
-
5.5%
]
5.15%
29117.2%
[
5.0%
-
5.5%
]
5.37%
1,35918.2%
[
5.5%
-
6.0%
]
5.91%
2,54014.3%
[
6.0%
-
6.5%
]
6.27%
55818.1%
[
6.0%
-
6.5%
]
6.44%
65211.7%
[
6.5%
-
7.0%
]
6.98%
3,78115.3%
[
7.0%
-
7.5%
]
7.20%
6259.6%
[
7.0%
-
7.5%
]
7.25%
2,08422.2%
[
7.5%
-
8.0%
]
7.58%
96310.6%
[
8.0%
-
8.5%
]
8.14%
1,0567.1%
[
10.0%
-
10.5%
]
10.42%
43213.9%
[
10.5%
-
11.0%
]
10.87%
2764.3%
[
22.0%
-
22.5%
]
22.45%
1969.2%
[
28.0%
-
28.5%
]
28.38%
3037.9%