South American Indian 3 or more Vehicles in Household

COMPARE

South American Indian
Race
Ancestry
AfghanAfricanAlaska NativeAlaskan AthabascanAlbanianAleutAlsatianAmericanApacheArabArapahoArgentineanArmenianAssyrian/Chaldean/SyriacAustralianAustrianBahamianBangladeshiBarbadianBasqueBelgianBelizeanBermudanBhutaneseBlackfeetBolivianBrazilianBritishBritish West IndianBulgarianBurmeseCajunCambodianCanadianCape VerdeanCarpatho RusynCelticCentral AmericanCentral American IndianCherokeeCheyenneChickasawChileanChineseChippewaChoctawColombianColvilleComancheCosta RicanCreeCreekCroatianCrowCubanCypriotCzechCzechoslovakianDanishDelawareDominicanDutchDutch West IndianEastern EuropeanEcuadorianEgyptianEnglishEstonianEthiopianEuropeanFijianFilipinoFinnishFrenchFrench American IndianFrench CanadianGermanGerman RussianGhanaianGreekGuamanian/ChamorroGuatemalanGuyaneseHaitianHmongHonduranHopiHoumaHungarianIcelanderIndian (Asian)IndonesianInupiatIranianIraqiIrishIroquoisIsraeliItalianJamaicanJapaneseJordanianKenyanKiowaKoreanLaotianLatvianLebaneseLiberianLithuanianLumbeeLuxembourgerMacedonianMalaysianMalteseMarshalleseMenomineeMexicanMexican American IndianMongolianMoroccanNative HawaiianNavajoNepaleseNew ZealanderNicaraguanNigerianNorthern EuropeanNorwegianOkinawanOsageOttawaPaiutePakistaniPalestinianPanamanianParaguayanPennsylvania GermanPeruvianPimaPolishPortuguesePotawatomiPuebloPuerto RicanPuget Sound SalishRomanianRussianSalvadoranSamoanScandinavianScotch-IrishScottishSeminoleSenegaleseSerbianShoshoneSierra LeoneanSiouxSlavicSlovakSloveneSomaliSouth AfricanSouth AmericanSouth American IndianSoviet UnionSpaniardSpanishSpanish AmericanSpanish American IndianSri LankanSubsaharan AfricanSudaneseSwedishSwissSyrianTaiwaneseThaiTlingit-HaidaTohono O'OdhamTonganTrinidadian and TobagonianTsimshianTurkishU.S. Virgin IslanderUgandanUkrainianUruguayanUteVenezuelanVietnameseWelshWest IndianYakamaYaquiYugoslavianYumanYup'ikZimbabwean
Immigration
NonimmigrantsImmigrantsAfghanistanAfricaAlbaniaArgentinaArmeniaAsiaAustraliaAustriaBahamasBangladeshBarbadosBelarusBelgiumBelizeBoliviaBosnia and HerzegovinaBrazilBulgariaBurma/MyanmarCabo VerdeCambodiaCameroonCanadaCaribbeanCentral AmericaChileChinaColombiaCongoCosta RicaCroatiaCubaCzechoslovakiaDenmarkDominicaDominican RepublicEastern AfricaEastern AsiaEastern EuropeEcuadorEgyptEl SalvadorEnglandEritreaEthiopiaEuropeFijiFranceGermanyGhanaGreeceGrenadaGuatemalaGuyanaHaitiHondurasHong KongHungaryIndiaIndonesiaIranIraqIrelandIsraelItalyJamaicaJapanJordanKazakhstanKenyaKoreaKuwaitLaosLatin AmericaLatviaLebanonLiberiaLithuaniaMalaysiaMexicoMicronesiaMiddle AfricaMoldovaMoroccoNepalNetherlandsNicaraguaNigeriaNorth AmericaNorth MacedoniaNorthern AfricaNorthern EuropeNorwayOceaniaPakistanPanamaPeruPhilippinesPolandPortugalRomaniaRussiaSaudi ArabiaScotlandSenegalSerbiaSierra LeoneSingaporeSomaliaSouth AfricaSouth AmericaSouth Central AsiaSouth Eastern AsiaSouthern EuropeSpainSri LankaSt. Vincent and the GrenadinesSudanSwedenSwitzerlandSyriaTaiwanThailandTrinidad and TobagoTurkeyUgandaUkraineUruguayUzbekistanVenezuelaVietnamWest IndiesWestern AfricaWestern AsiaWestern EuropeYemenZaireZimbabweAzores
Select to Compare
Race
Ancestry
AfghanAfricanAlaska NativeAlaskan AthabascanAlbanianAleutAlsatianAmericanApacheArabArapahoArgentineanArmenianAssyrian/Chaldean/SyriacAustralianAustrianBahamianBangladeshiBarbadianBasqueBelgianBelizeanBermudanBhutaneseBlackfeetBolivianBrazilianBritishBritish West IndianBulgarianBurmeseCajunCambodianCanadianCape VerdeanCarpatho RusynCelticCentral AmericanCentral American IndianCherokeeCheyenneChickasawChileanChineseChippewaChoctawColombianColvilleComancheCosta RicanCreeCreekCroatianCrowCubanCypriotCzechCzechoslovakianDanishDelawareDominicanDutchDutch West IndianEastern EuropeanEcuadorianEgyptianEnglishEstonianEthiopianEuropeanFijianFilipinoFinnishFrenchFrench American IndianFrench CanadianGermanGerman RussianGhanaianGreekGuamanian/ChamorroGuatemalanGuyaneseHaitianHmongHonduranHopiHoumaHungarianIcelanderIndian (Asian)IndonesianInupiatIranianIraqiIrishIroquoisIsraeliItalianJamaicanJapaneseJordanianKenyanKiowaKoreanLaotianLatvianLebaneseLiberianLithuanianLumbeeLuxembourgerMacedonianMalaysianMalteseMarshalleseMenomineeMexicanMexican American IndianMongolianMoroccanNative HawaiianNavajoNepaleseNew ZealanderNicaraguanNigerianNorthern EuropeanNorwegianOkinawanOsageOttawaPaiutePakistaniPalestinianPanamanianParaguayanPennsylvania GermanPeruvianPimaPolishPortuguesePotawatomiPuebloPuerto RicanPuget Sound SalishRomanianRussianSalvadoranSamoanScandinavianScotch-IrishScottishSeminoleSenegaleseSerbianShoshoneSierra LeoneanSiouxSlavicSlovakSloveneSomaliSouth AfricanSouth AmericanSoviet UnionSpaniardSpanishSpanish AmericanSpanish American IndianSri LankanSubsaharan AfricanSudaneseSwedishSwissSyrianTaiwaneseThaiTlingit-HaidaTohono O'OdhamTonganTrinidadian and TobagonianTsimshianTurkishU.S. Virgin IslanderUgandanUkrainianUruguayanUteVenezuelanVietnameseWelshWest IndianYakamaYaquiYugoslavianYumanYup'ikZimbabwean
Immigration
NonimmigrantsImmigrantsAfghanistanAfricaAlbaniaArgentinaArmeniaAsiaAustraliaAustriaBahamasBangladeshBarbadosBelarusBelgiumBelizeBoliviaBosnia and HerzegovinaBrazilBulgariaBurma/MyanmarCabo VerdeCambodiaCameroonCanadaCaribbeanCentral AmericaChileChinaColombiaCongoCosta RicaCroatiaCubaCzechoslovakiaDenmarkDominicaDominican RepublicEastern AfricaEastern AsiaEastern EuropeEcuadorEgyptEl SalvadorEnglandEritreaEthiopiaEuropeFijiFranceGermanyGhanaGreeceGrenadaGuatemalaGuyanaHaitiHondurasHong KongHungaryIndiaIndonesiaIranIraqIrelandIsraelItalyJamaicaJapanJordanKazakhstanKenyaKoreaKuwaitLaosLatin AmericaLatviaLebanonLiberiaLithuaniaMalaysiaMexicoMicronesiaMiddle AfricaMoldovaMoroccoNepalNetherlandsNicaraguaNigeriaNorth AmericaNorth MacedoniaNorthern AfricaNorthern EuropeNorwayOceaniaPakistanPanamaPeruPhilippinesPolandPortugalRomaniaRussiaSaudi ArabiaScotlandSenegalSerbiaSierra LeoneSingaporeSomaliaSouth AfricaSouth AmericaSouth Central AsiaSouth Eastern AsiaSouthern EuropeSpainSri LankaSt. Vincent and the GrenadinesSudanSwedenSwitzerlandSyriaTaiwanThailandTrinidad and TobagoTurkeyUgandaUkraineUruguayUzbekistanVenezuelaVietnamWest IndiesWestern AfricaWestern AsiaWestern EuropeYemenZaireZimbabweAzores
3 or more Vehicles in Household
Income
Poverty
Unemployment
Labor Participation
Family Structure
Vehicle Availability
Education Level
Disability

South American Indian 3 or more Vehicles in Household
Fair

19.1%
3+ VEHICLES AVAILABLE
25.4/ 100
METRIC RATING
191st/ 347
METRIC RANK

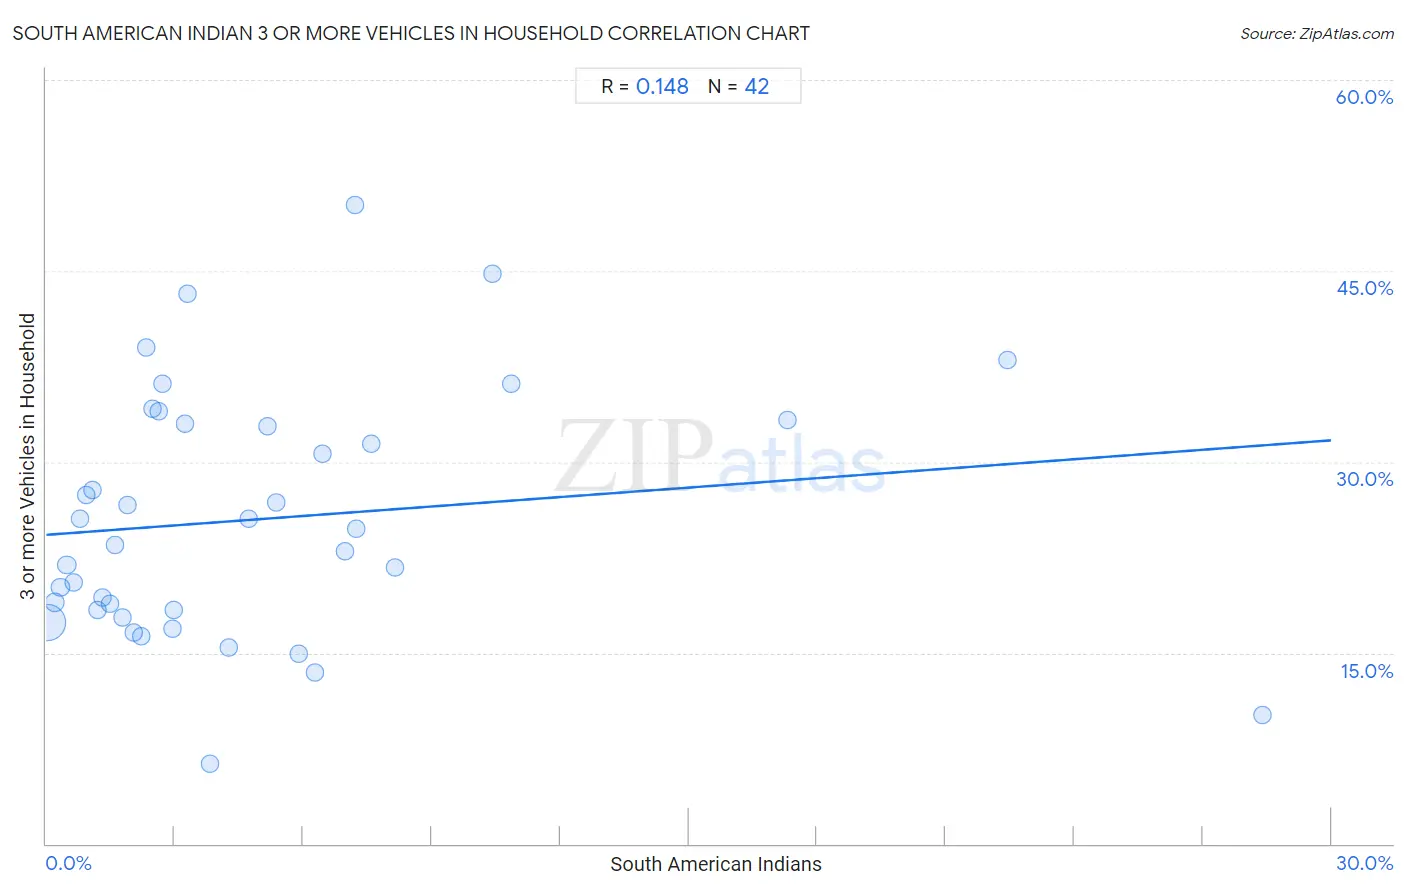
South American Indian 3 or more Vehicles in Household Correlation Chart

The statistical analysis conducted on geographies consisting of 164,522,375 people shows a poor positive correlation between the proportion of South American Indians and percentage of households with 3 or more vehicles available in the United States with a correlation coefficient (R) of 0.148 and weighted average of 19.1%. On average, for every 1% (one percent) increase in South American Indians within a typical geography, there is an increase of 0.25% in percentage of households with 3 or more vehicles available.
South American Indian 3 or more Vehicles in Household
It is essential to understand that the correlation between the percentage of South American Indians and percentage of households with 3 or more vehicles available does not imply a direct cause-and-effect relationship. It remains uncertain whether the presence of South American Indians influences an upward or downward trend in the level of percentage of households with 3 or more vehicles available within an area, or if South American Indians simply ended up residing in those areas with higher or lower levels of percentage of households with 3 or more vehicles available due to other factors.

Demographics Similar to South American Indians by 3 or more Vehicles in Household

In terms of 3 or more vehicles in household, the demographic groups most similar to South American Indians are Immigrants from Zimbabwe (19.1%, a difference of 0.010%), Kenyan (19.1%, a difference of 0.060%), Immigrants from Kuwait (19.1%, a difference of 0.070%), Indian (Asian) (19.1%, a difference of 0.070%), and Tsimshian (19.1%, a difference of 0.10%).
DemographicsRating | Rank3 or more Vehicles in Household
Latvians
35.7
/100
|
#184
Fair
19.3%
Immigrants from Sri Lanka
30.7
/100
|
#185
Fair
19.2%
Immigrants from Sweden
29.0
/100
|
#186
Fair
19.2%
Immigrants from Hong Kong
28.3
/100
|
#187
Fair
19.2%
Immigrants from Kuwait
26.1
/100
|
#188
Fair
19.1%
Indians (Asian)
26.0
/100
|
#189
Fair
19.1%
Immigrants from Zimbabwe
25.5
/100
|
#190
Fair
19.1%
South American Indians
25.4
/100
|
#191
Fair
19.1%
Kenyans
24.7
/100
|
#192
Fair
19.1%
Tsimshian
24.4
/100
|
#193
Fair
19.1%
Serbians
24.0
/100
|
#194
Fair
19.1%
Immigrants from Moldova
23.6
/100
|
#195
Fair
19.1%
Central American Indians
22.2
/100
|
#196
Fair
19.0%
Immigrants from Japan
22.0
/100
|
#197
Fair
19.0%
Egyptians
19.5
/100
|
#198
Poor
19.0%

South American Indian 3 or more Vehicles in Household Correlation Summary

MeasurementSouth American Indian Data3 or more Vehicles in Household Data
Minimum0.038%6.3%
Maximum28.4%50.2%
Range28.3%43.9%
Mean5.0%25.5%
Median3.0%24.1%
Interquartile 25% (IQ1)1.5%18.3%
Interquartile 75% (IQ3)6.4%33.0%
Interquartile Range (IQR)5.0%14.7%
Standard Deviation (Sample)5.8%9.8%
Standard Deviation (Population)5.8%9.6%

Correlation Details

South American Indian PercentileSample Size3 or more Vehicles in Household
[
0.0%
-
0.5%
]
0.038%
145,849,19917.4%
[
0.0%
-
0.5%
]
0.20%
12,420,74718.9%
[
0.0%
-
0.5%
]
0.33%
3,276,43320.1%
[
0.0%
-
0.5%
]
0.48%
1,017,74221.9%
[
0.5%
-
1.0%
]
0.63%
856,92120.5%
[
0.5%
-
1.0%
]
0.78%
363,54025.5%
[
0.5%
-
1.0%
]
0.93%
111,67427.4%
[
1.0%
-
1.5%
]
1.07%
207,68827.8%
[
1.0%
-
1.5%
]
1.19%
106,66718.3%
[
1.0%
-
1.5%
]
1.32%
122,59619.4%
[
1.0%
-
1.5%
]
1.48%
34,88718.9%
[
1.5%
-
2.0%
]
1.61%
19,88823.5%
[
1.5%
-
2.0%
]
1.77%
23,02817.8%
[
1.5%
-
2.0%
]
1.90%
11,60126.6%
[
2.0%
-
2.5%
]
2.05%
3,11816.6%
[
2.0%
-
2.5%
]
2.22%
34,79816.3%
[
2.0%
-
2.5%
]
2.33%
1,59038.9%
[
2.0%
-
2.5%
]
2.48%
12134.1%
[
2.5%
-
3.0%
]
2.63%
1,67634.0%
[
2.5%
-
3.0%
]
2.71%
14,23536.2%
[
2.5%
-
3.0%
]
2.95%
6,29916.9%
[
2.5%
-
3.0%
]
2.99%
1,17218.4%
[
3.0%
-
3.5%
]
3.23%
13,11133.0%
[
3.0%
-
3.5%
]
3.29%
1,03543.2%
[
3.5%
-
4.0%
]
3.84%
3,8836.3%
[
4.0%
-
4.5%
]
4.25%
72915.4%
[
4.5%
-
5.0%
]
4.74%
2,82925.5%
[
5.0%
-
5.5%
]
5.15%
29132.8%
[
5.0%
-
5.5%
]
5.37%
1,35926.8%
[
5.5%
-
6.0%
]
5.91%
2,54014.9%
[
6.0%
-
6.5%
]
6.27%
55813.5%
[
6.0%
-
6.5%
]
6.44%
65230.7%
[
6.5%
-
7.0%
]
6.98%
3,78123.0%
[
7.0%
-
7.5%
]
7.20%
62550.2%
[
7.0%
-
7.5%
]
7.25%
2,08424.7%
[
7.5%
-
8.0%
]
7.58%
96331.4%
[
8.0%
-
8.5%
]
8.14%
1,05621.7%
[
10.0%
-
10.5%
]
10.42%
43244.8%
[
10.5%
-
11.0%
]
10.87%
27636.2%
[
17.0%
-
17.5%
]
17.31%
5233.3%
[
22.0%
-
22.5%
]
22.45%
19638.0%
[
28.0%
-
28.5%
]
28.38%
30310.1%