Puerto Rican Married-couple Households
COMPARE
Puerto Rican
Select to Compare
Married-couple Households
Puerto Rican Married-couple Households
40.1%
MARRIED-COUPLE HOUSEHOLDS
0.0/ 100
METRIC RATING
323rd/ 347
METRIC RANK
Puerto Rican Married-couple Households Correlation Chart
The statistical analysis conducted on geographies consisting of 527,687,187 people shows a mild negative correlation between the proportion of Puerto Ricans and percentage of married-couple family households in the United States with a correlation coefficient (R) of -0.317 and weighted average of 40.1%. On average, for every 1% (one percent) increase in Puerto Ricans within a typical geography, there is a decrease of 0.11% in percentage of married-couple family households.
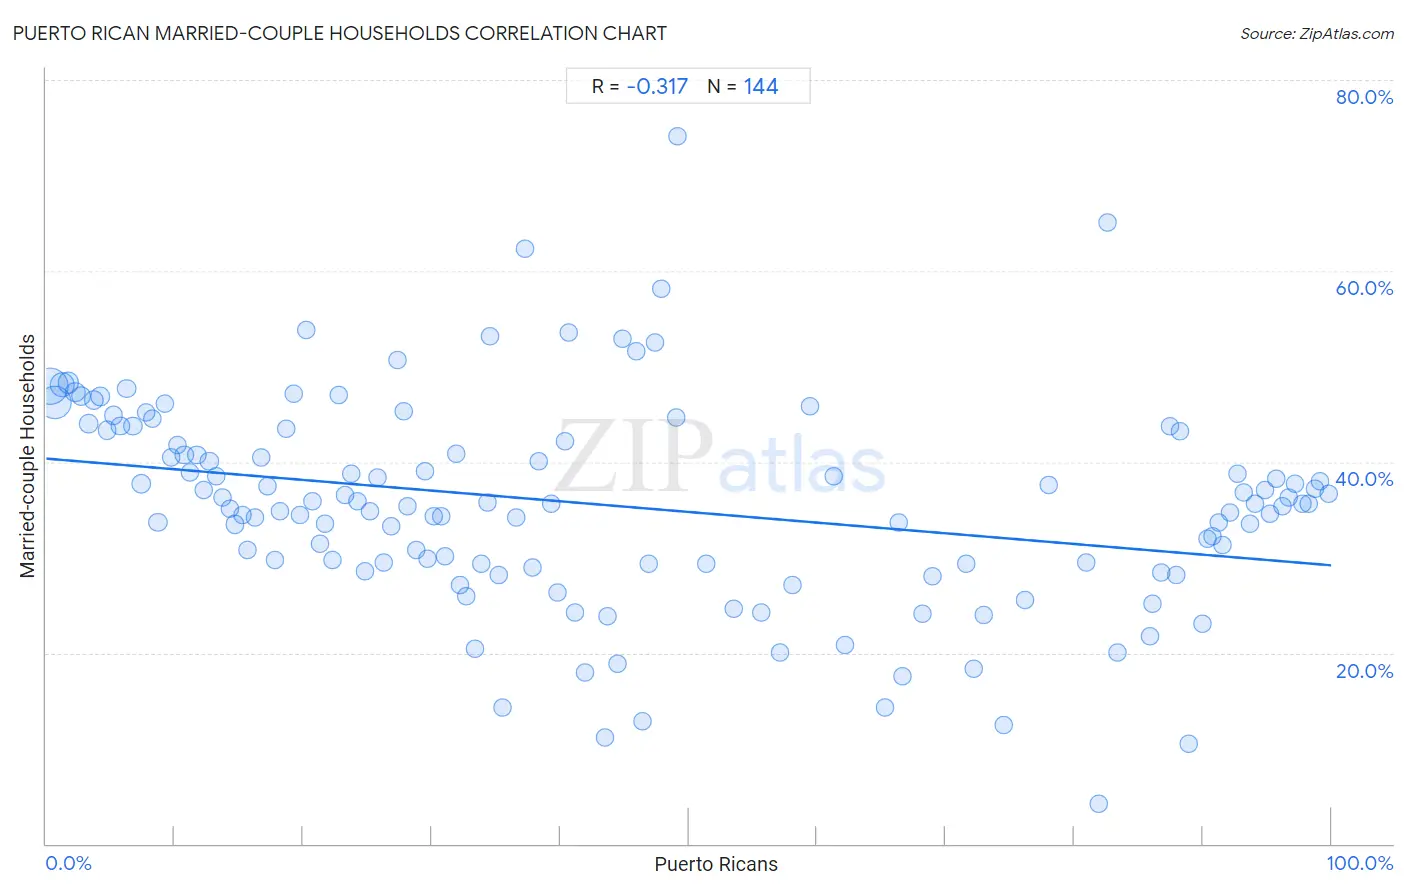
It is essential to understand that the correlation between the percentage of Puerto Ricans and percentage of married-couple family households does not imply a direct cause-and-effect relationship. It remains uncertain whether the presence of Puerto Ricans influences an upward or downward trend in the level of percentage of married-couple family households within an area, or if Puerto Ricans simply ended up residing in those areas with higher or lower levels of percentage of married-couple family households due to other factors.
Demographics Similar to Puerto Ricans by Married-couple Households
In terms of married-couple households, the demographic groups most similar to Puerto Ricans are Immigrants from Zaire (40.1%, a difference of 0.0%), Navajo (40.1%, a difference of 0.010%), Pueblo (40.0%, a difference of 0.24%), Immigrants from Liberia (40.3%, a difference of 0.66%), and West Indian (40.3%, a difference of 0.70%).
| Demographics | Rating | Rank | Married-couple Households |
| Immigrants from Caribbean | 0.0 /100 | #316 | Tragic 40.8% |
| Immigrants from Jamaica | 0.0 /100 | #317 | Tragic 40.7% |
| Liberians | 0.0 /100 | #318 | Tragic 40.7% |
| Bahamians | 0.0 /100 | #319 | Tragic 40.5% |
| West Indians | 0.0 /100 | #320 | Tragic 40.3% |
| Immigrants from Liberia | 0.0 /100 | #321 | Tragic 40.3% |
| Immigrants from Zaire | 0.0 /100 | #322 | Tragic 40.1% |
| Puerto Ricans | 0.0 /100 | #323 | Tragic 40.1% |
| Navajo | 0.0 /100 | #324 | Tragic 40.1% |
| Pueblo | 0.0 /100 | #325 | Tragic 40.0% |
| U.S. Virgin Islanders | 0.0 /100 | #326 | Tragic 39.8% |
| Lumbee | 0.0 /100 | #327 | Tragic 39.6% |
| Barbadians | 0.0 /100 | #328 | Tragic 39.4% |
| Immigrants from Dominica | 0.0 /100 | #329 | Tragic 39.4% |
| Immigrants from Barbados | 0.0 /100 | #330 | Tragic 39.2% |
Puerto Rican Married-couple Households Correlation Summary
| Measurement | Puerto Rican Data | Married-couple Households Data |
| Minimum | 0.28% | 4.2% |
| Maximum | 99.8% | 74.1% |
| Range | 99.6% | 69.9% |
| Mean | 44.2% | 35.4% |
| Median | 36.1% | 35.6% |
| Interquartile 25% (IQ1) | 18.0% | 29.3% |
| Interquartile 75% (IQ3) | 72.6% | 42.7% |
| Interquartile Range (IQR) | 54.6% | 13.4% |
| Standard Deviation (Sample) | 31.3% | 11.0% |
| Standard Deviation (Population) | 31.2% | 11.0% |
Correlation Details
| Puerto Rican Percentile | Sample Size | Married-couple Households |
[ 0.0% - 0.5% ] 0.28% | 168,967,293 | 47.9% |
[ 0.5% - 1.0% ] 0.72% | 136,638,683 | 46.3% |
[ 1.0% - 1.5% ] 1.22% | 60,797,738 | 48.0% |
[ 1.5% - 2.0% ] 1.73% | 30,234,023 | 48.3% |
[ 2.0% - 2.5% ] 2.23% | 17,841,380 | 47.3% |
[ 2.5% - 3.0% ] 2.74% | 14,131,750 | 46.9% |
[ 3.0% - 3.5% ] 3.29% | 12,948,294 | 44.0% |
[ 3.5% - 4.0% ] 3.72% | 10,145,850 | 46.5% |
[ 4.0% - 4.5% ] 4.23% | 7,305,312 | 46.9% |
[ 4.5% - 5.0% ] 4.75% | 6,954,288 | 43.3% |
[ 5.0% - 5.5% ] 5.22% | 4,690,327 | 44.9% |
[ 5.5% - 6.0% ] 5.75% | 4,769,337 | 43.8% |
[ 6.0% - 6.5% ] 6.26% | 3,527,644 | 47.6% |
[ 6.5% - 7.0% ] 6.76% | 3,457,685 | 43.7% |
[ 7.0% - 7.5% ] 7.43% | 11,184,830 | 37.8% |
[ 7.5% - 8.0% ] 7.78% | 2,259,815 | 45.2% |
[ 8.0% - 8.5% ] 8.25% | 2,105,815 | 44.6% |
[ 8.5% - 9.0% ] 8.68% | 3,964,152 | 33.6% |
[ 9.0% - 9.5% ] 9.25% | 2,117,624 | 46.1% |
[ 9.5% - 10.0% ] 9.71% | 1,977,105 | 40.4% |
[ 10.0% - 10.5% ] 10.24% | 857,941 | 41.8% |
[ 10.5% - 11.0% ] 10.75% | 1,511,063 | 40.7% |
[ 11.0% - 11.5% ] 11.21% | 883,505 | 38.9% |
[ 11.5% - 12.0% ] 11.72% | 810,764 | 40.7% |
[ 12.0% - 12.5% ] 12.21% | 635,260 | 37.1% |
[ 12.5% - 13.0% ] 12.69% | 763,534 | 40.0% |
[ 13.0% - 13.5% ] 13.21% | 582,260 | 38.5% |
[ 13.5% - 14.0% ] 13.68% | 436,486 | 36.3% |
[ 14.0% - 14.5% ] 14.31% | 781,403 | 35.0% |
[ 14.5% - 15.0% ] 14.70% | 824,117 | 33.5% |
[ 15.0% - 15.5% ] 15.31% | 154,114 | 34.4% |
[ 15.5% - 16.0% ] 15.70% | 879,665 | 30.8% |
[ 16.0% - 16.5% ] 16.26% | 439,560 | 34.2% |
[ 16.5% - 17.0% ] 16.77% | 530,543 | 40.4% |
[ 17.0% - 17.5% ] 17.25% | 242,346 | 37.4% |
[ 17.5% - 18.0% ] 17.82% | 305,775 | 29.7% |
[ 18.0% - 18.5% ] 18.16% | 368,623 | 34.8% |
[ 18.5% - 19.0% ] 18.64% | 189,506 | 43.5% |
[ 19.0% - 19.5% ] 19.27% | 203,378 | 47.2% |
[ 19.5% - 20.0% ] 19.76% | 218,922 | 34.4% |
[ 20.0% - 20.5% ] 20.23% | 93,241 | 53.8% |
[ 20.5% - 21.0% ] 20.69% | 356,341 | 35.9% |
[ 21.0% - 21.5% ] 21.28% | 324,190 | 31.4% |
[ 21.5% - 22.0% ] 21.70% | 147,984 | 33.5% |
[ 22.0% - 22.5% ] 22.25% | 72,504 | 29.8% |
[ 22.5% - 23.0% ] 22.78% | 159,582 | 47.0% |
[ 23.0% - 23.5% ] 23.26% | 259,604 | 36.6% |
[ 23.5% - 24.0% ] 23.75% | 54,725 | 38.8% |
[ 24.0% - 24.5% ] 24.21% | 192,848 | 35.9% |
[ 24.5% - 25.0% ] 24.78% | 41,372 | 28.5% |
[ 25.0% - 25.5% ] 25.17% | 74,666 | 34.9% |
[ 25.5% - 26.0% ] 25.78% | 295,213 | 38.3% |
[ 26.0% - 26.5% ] 26.24% | 113,553 | 29.4% |
[ 26.5% - 27.0% ] 26.82% | 211,727 | 33.3% |
[ 27.0% - 27.5% ] 27.29% | 115,892 | 50.6% |
[ 27.5% - 28.0% ] 27.85% | 84,562 | 45.3% |
[ 28.0% - 28.5% ] 28.10% | 207,807 | 35.4% |
[ 28.5% - 29.0% ] 28.75% | 138,280 | 30.7% |
[ 29.0% - 29.5% ] 29.43% | 90,190 | 39.0% |
[ 29.5% - 30.0% ] 29.70% | 120,128 | 29.8% |
[ 30.0% - 30.5% ] 30.13% | 50,636 | 34.3% |
[ 30.5% - 31.0% ] 30.78% | 29,086 | 34.3% |
[ 31.0% - 31.5% ] 31.05% | 50,450 | 30.1% |
[ 31.5% - 32.0% ] 31.94% | 128,309 | 40.9% |
[ 32.0% - 32.5% ] 32.18% | 64,650 | 27.1% |
[ 32.5% - 33.0% ] 32.66% | 154,688 | 25.9% |
[ 33.0% - 33.5% ] 33.32% | 121,057 | 20.4% |
[ 33.5% - 34.0% ] 33.83% | 74,304 | 29.3% |
[ 34.0% - 34.5% ] 34.38% | 128 | 35.7% |
[ 34.5% - 35.0% ] 34.57% | 71,241 | 53.2% |
[ 35.0% - 35.5% ] 35.17% | 39,166 | 28.2% |
[ 35.5% - 36.0% ] 35.53% | 13,479 | 14.3% |
[ 36.5% - 37.0% ] 36.60% | 68,452 | 34.2% |
[ 37.0% - 37.5% ] 37.24% | 19,973 | 62.3% |
[ 37.5% - 38.0% ] 37.86% | 9,467 | 28.9% |
[ 38.0% - 38.5% ] 38.35% | 16,024 | 40.0% |
[ 39.0% - 39.5% ] 39.30% | 195,614 | 35.6% |
[ 39.5% - 40.0% ] 39.75% | 51,980 | 26.3% |
[ 40.0% - 40.5% ] 40.34% | 76,094 | 42.2% |
[ 40.5% - 41.0% ] 40.69% | 69,311 | 53.6% |
[ 41.0% - 41.5% ] 41.13% | 44,030 | 24.2% |
[ 41.5% - 42.0% ] 41.93% | 62,474 | 17.9% |
[ 43.0% - 43.5% ] 43.47% | 8,418 | 11.2% |
[ 43.5% - 44.0% ] 43.72% | 70,222 | 23.9% |
[ 44.0% - 44.5% ] 44.43% | 25,642 | 18.8% |
[ 44.5% - 45.0% ] 44.86% | 43,664 | 52.9% |
[ 45.5% - 46.0% ] 45.93% | 34,257 | 51.6% |
[ 46.0% - 46.5% ] 46.38% | 1,022 | 12.8% |
[ 46.5% - 47.0% ] 46.89% | 77,830 | 29.3% |
[ 47.0% - 47.5% ] 47.40% | 327 | 52.5% |
[ 47.5% - 48.0% ] 47.85% | 466 | 58.1% |
[ 48.5% - 49.0% ] 49.00% | 549 | 44.6% |
[ 49.0% - 49.5% ] 49.17% | 899 | 74.1% |
[ 51.0% - 51.5% ] 51.41% | 22,606 | 29.3% |
[ 53.0% - 53.5% ] 53.49% | 86 | 24.6% |
[ 55.5% - 56.0% ] 55.67% | 697 | 24.2% |
[ 57.0% - 57.5% ] 57.14% | 42 | 20.0% |
[ 58.0% - 58.5% ] 58.07% | 12,443 | 27.2% |
[ 59.0% - 59.5% ] 59.42% | 69 | 45.8% |
[ 61.0% - 61.5% ] 61.26% | 253 | 38.5% |
[ 62.0% - 62.5% ] 62.20% | 246 | 20.8% |
[ 65.0% - 65.5% ] 65.24% | 12,045 | 14.3% |
[ 66.0% - 66.5% ] 66.33% | 781 | 33.6% |
[ 66.5% - 67.0% ] 66.65% | 17,941 | 17.5% |
[ 68.0% - 68.5% ] 68.15% | 7,087 | 24.1% |
[ 68.5% - 69.0% ] 68.99% | 8,220 | 28.0% |
[ 71.5% - 72.0% ] 71.61% | 701 | 29.3% |
[ 72.0% - 72.5% ] 72.22% | 24,713 | 18.3% |
[ 72.5% - 73.0% ] 72.96% | 5,955 | 24.0% |
[ 74.5% - 75.0% ] 74.52% | 5,260 | 12.4% |
[ 76.0% - 76.5% ] 76.20% | 17,293 | 25.5% |
[ 77.5% - 78.0% ] 77.98% | 20,075 | 37.6% |
[ 80.5% - 81.0% ] 80.95% | 16,607 | 29.5% |
[ 81.5% - 82.0% ] 81.92% | 553 | 4.2% |
[ 82.5% - 83.0% ] 82.54% | 590 | 65.1% |
[ 83.0% - 83.5% ] 83.33% | 3,233 | 20.1% |
[ 85.5% - 86.0% ] 85.92% | 38,239 | 21.7% |
[ 86.0% - 86.5% ] 86.12% | 342,297 | 25.2% |
[ 86.5% - 87.0% ] 86.74% | 40,064 | 28.4% |
[ 87.0% - 87.5% ] 87.45% | 17,323 | 43.7% |
[ 87.5% - 88.0% ] 87.90% | 4,562 | 28.2% |
[ 88.0% - 88.5% ] 88.19% | 40,300 | 43.2% |
[ 88.5% - 89.0% ] 88.88% | 7,068 | 10.5% |
[ 89.5% - 90.0% ] 89.97% | 13,876 | 23.0% |
[ 90.0% - 90.5% ] 90.35% | 147,165 | 32.0% |
[ 90.5% - 91.0% ] 90.80% | 33,138 | 32.3% |
[ 91.0% - 91.5% ] 91.25% | 189,184 | 33.6% |
[ 91.5% - 92.0% ] 91.58% | 606 | 31.4% |
[ 92.0% - 92.5% ] 92.08% | 51,852 | 34.7% |
[ 92.5% - 93.0% ] 92.66% | 25,965 | 38.7% |
[ 93.0% - 93.5% ] 93.15% | 110,548 | 36.8% |
[ 93.5% - 94.0% ] 93.63% | 30,160 | 33.5% |
[ 94.0% - 94.5% ] 94.10% | 281,717 | 35.6% |
[ 94.5% - 95.0% ] 94.81% | 235,271 | 37.0% |
[ 95.0% - 95.5% ] 95.25% | 311,824 | 34.5% |
[ 95.5% - 96.0% ] 95.73% | 149,189 | 38.3% |
[ 96.0% - 96.5% ] 96.18% | 329,088 | 35.4% |
[ 96.5% - 97.0% ] 96.73% | 352,386 | 36.3% |
[ 97.0% - 97.5% ] 97.19% | 196,560 | 37.7% |
[ 97.5% - 98.0% ] 97.73% | 522,681 | 35.6% |
[ 98.0% - 98.5% ] 98.27% | 376,077 | 35.6% |
[ 98.5% - 99.0% ] 98.78% | 508,516 | 37.1% |
[ 99.0% - 99.5% ] 99.17% | 450,589 | 38.0% |
[ 99.5% - 100.0% ] 99.83% | 237,418 | 36.7% |