Puerto Rican Disability Age Under 5
COMPARE
Puerto Rican
Select to Compare
Disability Age Under 5
Puerto Rican Disability Age Under 5
1.7%
DISABILITY | AGE UNDER 5
0.0/ 100
METRIC RATING
312th/ 347
METRIC RANK
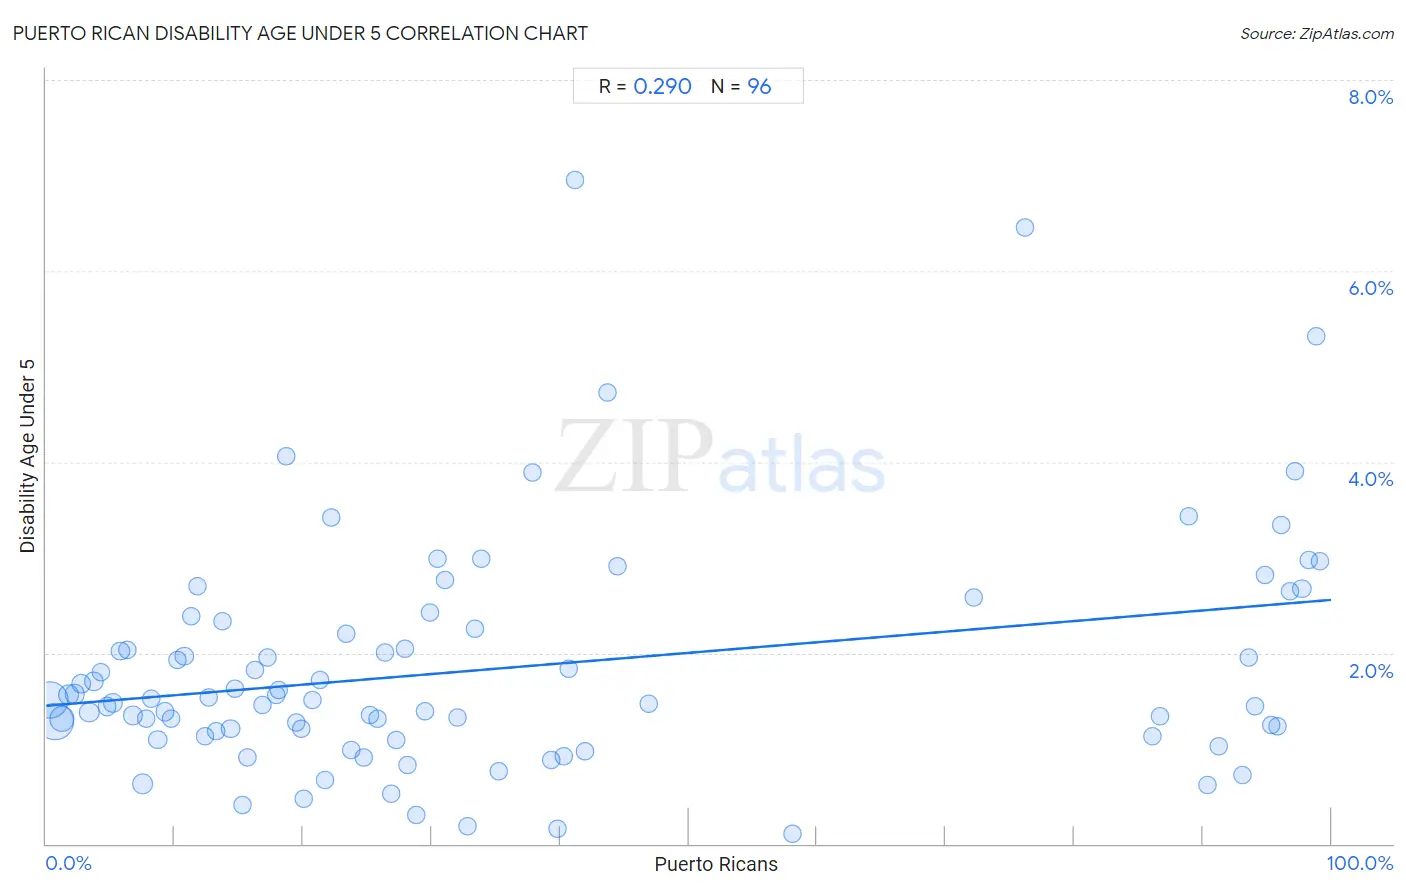
Puerto Rican Disability Age Under 5 Correlation Chart
The statistical analysis conducted on geographies consisting of 255,895,905 people shows a weak positive correlation between the proportion of Puerto Ricans and percentage of population with a disability under the age of 5 in the United States with a correlation coefficient (R) of 0.290 and weighted average of 1.7%. On average, for every 1% (one percent) increase in Puerto Ricans within a typical geography, there is an increase of 0.011% in percentage of population with a disability under the age of 5.
It is essential to understand that the correlation between the percentage of Puerto Ricans and percentage of population with a disability under the age of 5 does not imply a direct cause-and-effect relationship. It remains uncertain whether the presence of Puerto Ricans influences an upward or downward trend in the level of percentage of population with a disability under the age of 5 within an area, or if Puerto Ricans simply ended up residing in those areas with higher or lower levels of percentage of population with a disability under the age of 5 due to other factors.
Demographics Similar to Puerto Ricans by Disability Age Under 5
In terms of disability age under 5, the demographic groups most similar to Puerto Ricans are English (1.7%, a difference of 0.040%), Celtic (1.7%, a difference of 0.16%), Norwegian (1.7%, a difference of 0.32%), Dutch (1.7%, a difference of 0.58%), and White/Caucasian (1.7%, a difference of 0.63%).
| Demographics | Rating | Rank | Disability Age Under 5 |
| Blackfeet | 0.0 /100 | #305 | Tragic 1.6% |
| Creek | 0.0 /100 | #306 | Tragic 1.6% |
| Scottish | 0.0 /100 | #307 | Tragic 1.6% |
| Navajo | 0.0 /100 | #308 | Tragic 1.6% |
| Cape Verdeans | 0.0 /100 | #309 | Tragic 1.7% |
| Whites/Caucasians | 0.0 /100 | #310 | Tragic 1.7% |
| English | 0.0 /100 | #311 | Tragic 1.7% |
| Puerto Ricans | 0.0 /100 | #312 | Tragic 1.7% |
| Celtics | 0.0 /100 | #313 | Tragic 1.7% |
| Norwegians | 0.0 /100 | #314 | Tragic 1.7% |
| Dutch | 0.0 /100 | #315 | Tragic 1.7% |
| Immigrants from Cabo Verde | 0.0 /100 | #316 | Tragic 1.7% |
| French | 0.0 /100 | #317 | Tragic 1.7% |
| Irish | 0.0 /100 | #318 | Tragic 1.7% |
| Slovaks | 0.0 /100 | #319 | Tragic 1.7% |
Puerto Rican Disability Age Under 5 Correlation Summary
| Measurement | Puerto Rican Data | Disability Age Under 5 Data |
| Minimum | 0.30% | 0.10% |
| Maximum | 99.1% | 6.9% |
| Range | 98.8% | 6.8% |
| Mean | 35.4% | 1.8% |
| Median | 25.0% | 1.5% |
| Interquartile 25% (IQ1) | 12.0% | 1.2% |
| Interquartile 75% (IQ3) | 42.8% | 2.3% |
| Interquartile Range (IQR) | 30.8% | 1.1% |
| Standard Deviation (Sample) | 31.7% | 1.2% |
| Standard Deviation (Population) | 31.6% | 1.2% |
Correlation Details
| Puerto Rican Percentile | Sample Size | Disability Age Under 5 |
[ 0.0% - 0.5% ] 0.30% | 77,258,248 | 1.5% |
[ 0.5% - 1.0% ] 0.71% | 74,786,383 | 1.3% |
[ 1.0% - 1.5% ] 1.22% | 30,264,063 | 1.3% |
[ 1.5% - 2.0% ] 1.72% | 11,435,088 | 1.6% |
[ 2.0% - 2.5% ] 2.22% | 7,011,950 | 1.6% |
[ 2.5% - 3.0% ] 2.74% | 5,626,067 | 1.7% |
[ 3.0% - 3.5% ] 3.35% | 6,148,989 | 1.4% |
[ 3.5% - 4.0% ] 3.70% | 4,202,963 | 1.7% |
[ 4.0% - 4.5% ] 4.24% | 3,052,471 | 1.8% |
[ 4.5% - 5.0% ] 4.74% | 3,135,142 | 1.4% |
[ 5.0% - 5.5% ] 5.20% | 2,018,806 | 1.5% |
[ 5.5% - 6.0% ] 5.77% | 1,747,200 | 2.0% |
[ 6.0% - 6.5% ] 6.28% | 1,126,531 | 2.0% |
[ 6.5% - 7.0% ] 6.75% | 1,617,733 | 1.3% |
[ 7.0% - 7.5% ] 7.46% | 9,489,250 | 0.63% |
[ 7.5% - 8.0% ] 7.76% | 740,671 | 1.3% |
[ 8.0% - 8.5% ] 8.18% | 475,734 | 1.5% |
[ 8.5% - 9.0% ] 8.67% | 3,056,228 | 1.1% |
[ 9.0% - 9.5% ] 9.24% | 1,029,771 | 1.4% |
[ 9.5% - 10.0% ] 9.72% | 986,378 | 1.3% |
[ 10.0% - 10.5% ] 10.25% | 429,953 | 1.9% |
[ 10.5% - 11.0% ] 10.74% | 679,319 | 2.0% |
[ 11.0% - 11.5% ] 11.32% | 189,771 | 2.4% |
[ 11.5% - 12.0% ] 11.73% | 241,663 | 2.7% |
[ 12.0% - 12.5% ] 12.35% | 79,223 | 1.1% |
[ 12.5% - 13.0% ] 12.69% | 333,386 | 1.5% |
[ 13.0% - 13.5% ] 13.23% | 359,569 | 1.2% |
[ 13.5% - 14.0% ] 13.74% | 164,647 | 2.3% |
[ 14.0% - 14.5% ] 14.34% | 445,937 | 1.2% |
[ 14.5% - 15.0% ] 14.67% | 552,443 | 1.6% |
[ 15.0% - 15.5% ] 15.27% | 85,062 | 0.40% |
[ 15.5% - 16.0% ] 15.68% | 750,099 | 0.91% |
[ 16.0% - 16.5% ] 16.22% | 318,906 | 1.8% |
[ 16.5% - 17.0% ] 16.79% | 184,936 | 1.5% |
[ 17.0% - 17.5% ] 17.22% | 170,680 | 2.0% |
[ 17.5% - 18.0% ] 17.90% | 170,857 | 1.6% |
[ 18.0% - 18.5% ] 18.11% | 229,150 | 1.6% |
[ 18.5% - 19.0% ] 18.65% | 112,825 | 4.1% |
[ 19.0% - 19.5% ] 19.44% | 33,455 | 1.3% |
[ 19.5% - 20.0% ] 19.82% | 44,782 | 1.2% |
[ 20.0% - 20.5% ] 20.04% | 45,765 | 0.47% |
[ 20.5% - 21.0% ] 20.68% | 194,310 | 1.5% |
[ 21.0% - 21.5% ] 21.29% | 254,009 | 1.7% |
[ 21.5% - 22.0% ] 21.71% | 114,480 | 0.67% |
[ 22.0% - 22.5% ] 22.14% | 15,459 | 3.4% |
[ 23.0% - 23.5% ] 23.31% | 126,833 | 2.2% |
[ 23.5% - 24.0% ] 23.75% | 50,868 | 0.98% |
[ 24.5% - 25.0% ] 24.75% | 30,590 | 0.91% |
[ 25.0% - 25.5% ] 25.23% | 11,118 | 1.4% |
[ 25.5% - 26.0% ] 25.77% | 88,969 | 1.3% |
[ 26.0% - 26.5% ] 26.41% | 45,753 | 2.0% |
[ 26.5% - 27.0% ] 26.82% | 194,542 | 0.52% |
[ 27.0% - 27.5% ] 27.26% | 42,207 | 1.1% |
[ 27.5% - 28.0% ] 27.88% | 59,851 | 2.0% |
[ 28.0% - 28.5% ] 28.10% | 181,677 | 0.83% |
[ 28.5% - 29.0% ] 28.81% | 71,799 | 0.30% |
[ 29.0% - 29.5% ] 29.49% | 54,464 | 1.4% |
[ 29.5% - 30.0% ] 29.83% | 32,976 | 2.4% |
[ 30.0% - 30.5% ] 30.43% | 10,923 | 3.0% |
[ 31.0% - 31.5% ] 31.03% | 47,961 | 2.8% |
[ 31.5% - 32.0% ] 31.98% | 78,478 | 1.3% |
[ 32.5% - 33.0% ] 32.75% | 94,601 | 0.19% |
[ 33.0% - 33.5% ] 33.32% | 121,057 | 2.2% |
[ 33.5% - 34.0% ] 33.83% | 74,212 | 3.0% |
[ 35.0% - 35.5% ] 35.17% | 26,615 | 0.76% |
[ 37.5% - 38.0% ] 37.86% | 9,467 | 3.9% |
[ 39.0% - 39.5% ] 39.30% | 194,833 | 0.88% |
[ 39.5% - 40.0% ] 39.75% | 51,640 | 0.15% |
[ 40.0% - 40.5% ] 40.30% | 44,793 | 0.92% |
[ 40.5% - 41.0% ] 40.69% | 69,311 | 1.8% |
[ 41.0% - 41.5% ] 41.13% | 44,030 | 6.9% |
[ 41.5% - 42.0% ] 41.93% | 62,474 | 0.97% |
[ 43.5% - 44.0% ] 43.71% | 31,711 | 4.7% |
[ 44.0% - 44.5% ] 44.43% | 25,642 | 2.9% |
[ 46.5% - 47.0% ] 46.90% | 76,420 | 1.5% |
[ 58.0% - 58.5% ] 58.07% | 12,443 | 0.10% |
[ 72.0% - 72.5% ] 72.22% | 24,713 | 2.6% |
[ 76.0% - 76.5% ] 76.20% | 17,293 | 6.5% |
[ 86.0% - 86.5% ] 86.12% | 322,616 | 1.1% |
[ 86.5% - 87.0% ] 86.71% | 24,760 | 1.3% |
[ 88.5% - 89.0% ] 88.88% | 7,068 | 3.4% |
[ 90.0% - 90.5% ] 90.37% | 117,247 | 0.61% |
[ 91.0% - 91.5% ] 91.28% | 41,784 | 1.0% |
[ 93.0% - 93.5% ] 93.10% | 93,751 | 0.72% |
[ 93.5% - 94.0% ] 93.62% | 27,301 | 1.9% |
[ 94.0% - 94.5% ] 94.10% | 276,569 | 1.4% |
[ 94.5% - 95.0% ] 94.85% | 126,370 | 2.8% |
[ 95.0% - 95.5% ] 95.30% | 145,275 | 1.2% |
[ 95.5% - 96.0% ] 95.79% | 65,841 | 1.2% |
[ 96.0% - 96.5% ] 96.11% | 185,754 | 3.3% |
[ 96.5% - 97.0% ] 96.79% | 107,556 | 2.6% |
[ 97.0% - 97.5% ] 97.16% | 41,280 | 3.9% |
[ 97.5% - 98.0% ] 97.71% | 267,893 | 2.7% |
[ 98.0% - 98.5% ] 98.29% | 103,523 | 3.0% |
[ 98.5% - 99.0% ] 98.79% | 217,265 | 5.3% |
[ 99.0% - 99.5% ] 99.12% | 203,436 | 3.0% |