Puerto Rican College, Under 1 year
COMPARE
Puerto Rican
Select to Compare
College, Under 1 year
Puerto Rican College, Under 1 year
56.8%
COLLEGE, UNDER 1 YEAR
0.0/ 100
METRIC RATING
319th/ 347
METRIC RANK
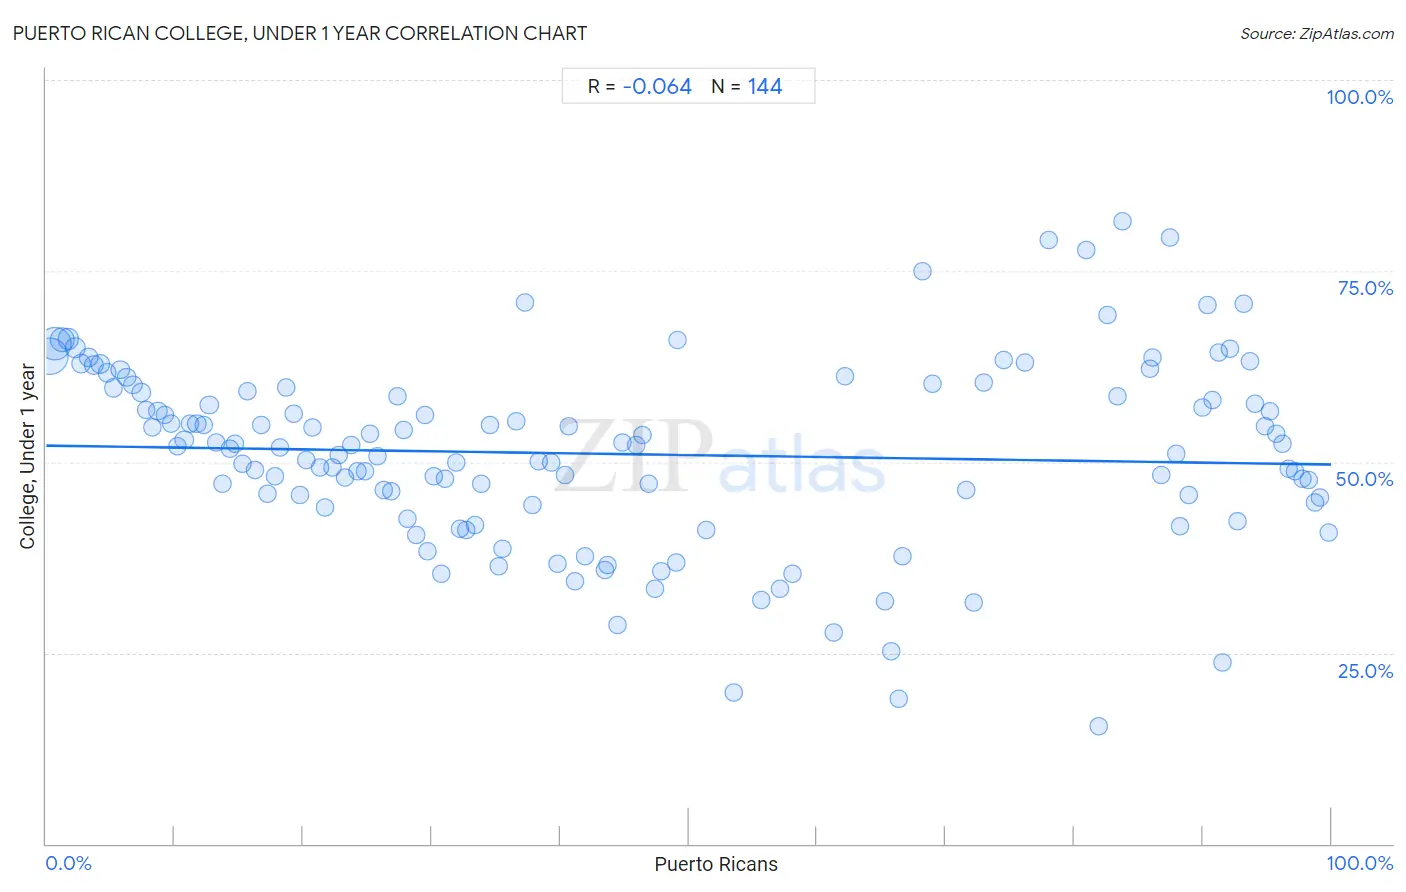
Puerto Rican College, Under 1 year Correlation Chart
The statistical analysis conducted on geographies consisting of 528,317,754 people shows a slight negative correlation between the proportion of Puerto Ricans and percentage of population with at least college, under 1 year education in the United States with a correlation coefficient (R) of -0.064 and weighted average of 56.8%. On average, for every 1% (one percent) increase in Puerto Ricans within a typical geography, there is a decrease of 0.025% in percentage of population with at least college, under 1 year education.
It is essential to understand that the correlation between the percentage of Puerto Ricans and percentage of population with at least college, under 1 year education does not imply a direct cause-and-effect relationship. It remains uncertain whether the presence of Puerto Ricans influences an upward or downward trend in the level of percentage of population with at least college, under 1 year education within an area, or if Puerto Ricans simply ended up residing in those areas with higher or lower levels of percentage of population with at least college, under 1 year education due to other factors.
Demographics Similar to Puerto Ricans by College, Under 1 year
In terms of college, under 1 year, the demographic groups most similar to Puerto Ricans are Guatemalan (56.8%, a difference of 0.060%), Immigrants from Haiti (56.9%, a difference of 0.20%), Hispanic or Latino (57.0%, a difference of 0.32%), Native/Alaskan (56.6%, a difference of 0.32%), and Menominee (57.0%, a difference of 0.36%).
| Demographics | Rating | Rank | College, Under 1 year |
| Salvadorans | 0.0 /100 | #312 | Tragic 57.3% |
| Dutch West Indians | 0.0 /100 | #313 | Tragic 57.2% |
| Hopi | 0.0 /100 | #314 | Tragic 57.1% |
| Hondurans | 0.0 /100 | #315 | Tragic 57.1% |
| Menominee | 0.0 /100 | #316 | Tragic 57.0% |
| Hispanics or Latinos | 0.0 /100 | #317 | Tragic 57.0% |
| Immigrants from Haiti | 0.0 /100 | #318 | Tragic 56.9% |
| Puerto Ricans | 0.0 /100 | #319 | Tragic 56.8% |
| Guatemalans | 0.0 /100 | #320 | Tragic 56.8% |
| Natives/Alaskans | 0.0 /100 | #321 | Tragic 56.6% |
| Immigrants from Caribbean | 0.0 /100 | #322 | Tragic 56.6% |
| Immigrants from Honduras | 0.0 /100 | #323 | Tragic 56.5% |
| Immigrants from El Salvador | 0.0 /100 | #324 | Tragic 56.4% |
| Immigrants from Latin America | 0.0 /100 | #325 | Tragic 56.3% |
| Navajo | 0.0 /100 | #326 | Tragic 56.3% |
Puerto Rican College, Under 1 year Correlation Summary
| Measurement | Puerto Rican Data | College, Under 1 year Data |
| Minimum | 0.28% | 15.4% |
| Maximum | 99.8% | 81.5% |
| Range | 99.6% | 66.1% |
| Mean | 44.6% | 51.0% |
| Median | 36.9% | 52.0% |
| Interquartile 25% (IQ1) | 18.0% | 44.5% |
| Interquartile 75% (IQ3) | 73.7% | 59.2% |
| Interquartile Range (IQR) | 55.8% | 14.7% |
| Standard Deviation (Sample) | 31.4% | 12.2% |
| Standard Deviation (Population) | 31.3% | 12.2% |
Correlation Details
| Puerto Rican Percentile | Sample Size | College, Under 1 year |
[ 0.0% - 0.5% ] 0.28% | 169,103,709 | 63.8% |
[ 0.5% - 1.0% ] 0.72% | 136,740,551 | 65.4% |
[ 1.0% - 1.5% ] 1.22% | 60,873,871 | 66.0% |
[ 1.5% - 2.0% ] 1.73% | 30,318,055 | 66.0% |
[ 2.0% - 2.5% ] 2.23% | 17,881,049 | 64.9% |
[ 2.5% - 3.0% ] 2.74% | 14,180,612 | 62.8% |
[ 3.0% - 3.5% ] 3.29% | 12,983,346 | 63.7% |
[ 3.5% - 4.0% ] 3.72% | 10,170,374 | 62.7% |
[ 4.0% - 4.5% ] 4.23% | 7,314,598 | 62.9% |
[ 4.5% - 5.0% ] 4.75% | 6,976,249 | 61.7% |
[ 5.0% - 5.5% ] 5.22% | 4,703,442 | 59.7% |
[ 5.5% - 6.0% ] 5.75% | 4,784,926 | 62.1% |
[ 6.0% - 6.5% ] 6.26% | 3,528,862 | 61.1% |
[ 6.5% - 7.0% ] 6.76% | 3,462,203 | 60.1% |
[ 7.0% - 7.5% ] 7.43% | 11,188,672 | 59.1% |
[ 7.5% - 8.0% ] 7.78% | 2,260,177 | 56.8% |
[ 8.0% - 8.5% ] 8.25% | 2,105,815 | 54.5% |
[ 8.5% - 9.0% ] 8.68% | 3,968,043 | 56.7% |
[ 9.0% - 9.5% ] 9.25% | 2,117,657 | 56.1% |
[ 9.5% - 10.0% ] 9.71% | 1,977,558 | 55.0% |
[ 10.0% - 10.5% ] 10.24% | 857,941 | 52.1% |
[ 10.5% - 11.0% ] 10.75% | 1,511,063 | 52.8% |
[ 11.0% - 11.5% ] 11.21% | 884,053 | 55.0% |
[ 11.5% - 12.0% ] 11.72% | 811,044 | 54.9% |
[ 12.0% - 12.5% ] 12.21% | 635,260 | 54.8% |
[ 12.5% - 13.0% ] 12.69% | 764,049 | 57.4% |
[ 13.0% - 13.5% ] 13.21% | 582,260 | 52.5% |
[ 13.5% - 14.0% ] 13.68% | 436,486 | 47.2% |
[ 14.0% - 14.5% ] 14.31% | 781,403 | 51.7% |
[ 14.5% - 15.0% ] 14.70% | 824,192 | 52.3% |
[ 15.0% - 15.5% ] 15.31% | 154,114 | 49.7% |
[ 15.5% - 16.0% ] 15.70% | 879,760 | 59.3% |
[ 16.0% - 16.5% ] 16.26% | 439,560 | 49.0% |
[ 16.5% - 17.0% ] 16.77% | 530,608 | 54.9% |
[ 17.0% - 17.5% ] 17.25% | 242,346 | 45.7% |
[ 17.5% - 18.0% ] 17.82% | 305,775 | 48.1% |
[ 18.0% - 18.5% ] 18.16% | 368,623 | 51.9% |
[ 18.5% - 19.0% ] 18.64% | 189,506 | 59.7% |
[ 19.0% - 19.5% ] 19.27% | 203,441 | 56.2% |
[ 19.5% - 20.0% ] 19.76% | 218,922 | 45.7% |
[ 20.0% - 20.5% ] 20.23% | 93,241 | 50.2% |
[ 20.5% - 21.0% ] 20.69% | 356,341 | 54.5% |
[ 21.0% - 21.5% ] 21.28% | 324,190 | 49.3% |
[ 21.5% - 22.0% ] 21.70% | 149,316 | 44.0% |
[ 22.0% - 22.5% ] 22.25% | 72,504 | 49.3% |
[ 22.5% - 23.0% ] 22.78% | 159,582 | 50.9% |
[ 23.0% - 23.5% ] 23.26% | 259,732 | 47.9% |
[ 23.5% - 24.0% ] 23.75% | 54,725 | 52.2% |
[ 24.0% - 24.5% ] 24.21% | 193,024 | 48.8% |
[ 24.5% - 25.0% ] 24.78% | 41,372 | 48.7% |
[ 25.0% - 25.5% ] 25.17% | 74,666 | 53.7% |
[ 25.5% - 26.0% ] 25.78% | 295,213 | 50.8% |
[ 26.0% - 26.5% ] 26.24% | 113,553 | 46.3% |
[ 26.5% - 27.0% ] 26.82% | 211,727 | 46.2% |
[ 27.0% - 27.5% ] 27.29% | 115,892 | 58.6% |
[ 27.5% - 28.0% ] 27.85% | 84,562 | 54.2% |
[ 28.0% - 28.5% ] 28.10% | 207,807 | 42.6% |
[ 28.5% - 29.0% ] 28.75% | 138,280 | 40.4% |
[ 29.0% - 29.5% ] 29.43% | 90,406 | 56.1% |
[ 29.5% - 30.0% ] 29.70% | 120,128 | 38.2% |
[ 30.0% - 30.5% ] 30.13% | 50,636 | 48.0% |
[ 30.5% - 31.0% ] 30.78% | 29,086 | 35.4% |
[ 31.0% - 31.5% ] 31.05% | 50,450 | 47.8% |
[ 31.5% - 32.0% ] 31.94% | 128,309 | 49.8% |
[ 32.0% - 32.5% ] 32.18% | 64,650 | 41.2% |
[ 32.5% - 33.0% ] 32.66% | 154,688 | 41.1% |
[ 33.0% - 33.5% ] 33.32% | 121,072 | 41.7% |
[ 33.5% - 34.0% ] 33.83% | 74,304 | 47.1% |
[ 34.5% - 35.0% ] 34.57% | 71,241 | 54.8% |
[ 35.0% - 35.5% ] 35.17% | 39,166 | 36.4% |
[ 35.5% - 36.0% ] 35.53% | 13,479 | 38.7% |
[ 36.5% - 37.0% ] 36.60% | 68,452 | 55.2% |
[ 37.0% - 37.5% ] 37.24% | 19,973 | 70.8% |
[ 37.5% - 38.0% ] 37.86% | 9,467 | 44.3% |
[ 38.0% - 38.5% ] 38.35% | 16,045 | 50.1% |
[ 39.0% - 39.5% ] 39.30% | 195,614 | 49.9% |
[ 39.5% - 40.0% ] 39.75% | 51,980 | 36.6% |
[ 40.0% - 40.5% ] 40.34% | 76,094 | 48.3% |
[ 40.5% - 41.0% ] 40.69% | 69,343 | 54.7% |
[ 41.0% - 41.5% ] 41.13% | 44,030 | 34.3% |
[ 41.5% - 42.0% ] 41.93% | 62,474 | 37.7% |
[ 43.0% - 43.5% ] 43.47% | 8,418 | 35.8% |
[ 43.5% - 44.0% ] 43.72% | 70,222 | 36.5% |
[ 44.0% - 44.5% ] 44.43% | 25,642 | 28.6% |
[ 44.5% - 45.0% ] 44.86% | 43,664 | 52.6% |
[ 45.5% - 46.0% ] 45.93% | 34,257 | 52.2% |
[ 46.0% - 46.5% ] 46.38% | 1,022 | 53.5% |
[ 46.5% - 47.0% ] 46.89% | 77,830 | 47.2% |
[ 47.0% - 47.5% ] 47.40% | 327 | 33.3% |
[ 47.5% - 48.0% ] 47.85% | 466 | 35.6% |
[ 48.5% - 49.0% ] 49.00% | 549 | 36.8% |
[ 49.0% - 49.5% ] 49.17% | 899 | 66.0% |
[ 51.0% - 51.5% ] 51.41% | 22,606 | 41.0% |
[ 53.0% - 53.5% ] 53.49% | 86 | 19.8% |
[ 55.5% - 56.0% ] 55.67% | 697 | 31.9% |
[ 57.0% - 57.5% ] 57.14% | 42 | 33.3% |
[ 58.0% - 58.5% ] 58.07% | 12,443 | 35.4% |
[ 61.0% - 61.5% ] 61.26% | 253 | 27.7% |
[ 62.0% - 62.5% ] 62.20% | 246 | 61.2% |
[ 65.0% - 65.5% ] 65.24% | 12,045 | 31.7% |
[ 65.5% - 66.0% ] 65.76% | 257 | 25.3% |
[ 66.0% - 66.5% ] 66.33% | 781 | 19.1% |
[ 66.5% - 67.0% ] 66.65% | 17,941 | 37.7% |
[ 68.0% - 68.5% ] 68.15% | 7,087 | 74.9% |
[ 68.5% - 69.0% ] 68.99% | 8,220 | 60.2% |
[ 71.5% - 72.0% ] 71.61% | 701 | 46.3% |
[ 72.0% - 72.5% ] 72.22% | 24,713 | 31.6% |
[ 72.5% - 73.0% ] 72.96% | 5,955 | 60.3% |
[ 74.5% - 75.0% ] 74.52% | 5,260 | 63.3% |
[ 76.0% - 76.5% ] 76.20% | 17,293 | 63.0% |
[ 77.5% - 78.0% ] 77.98% | 20,075 | 79.0% |
[ 80.5% - 81.0% ] 80.95% | 16,607 | 77.7% |
[ 81.5% - 82.0% ] 81.92% | 553 | 15.4% |
[ 82.5% - 83.0% ] 82.54% | 590 | 69.2% |
[ 83.0% - 83.5% ] 83.32% | 3,381 | 58.6% |
[ 83.5% - 84.0% ] 83.71% | 2,492 | 81.5% |
[ 85.5% - 86.0% ] 85.92% | 38,239 | 62.2% |
[ 86.0% - 86.5% ] 86.12% | 342,297 | 63.6% |
[ 86.5% - 87.0% ] 86.74% | 40,064 | 48.2% |
[ 87.0% - 87.5% ] 87.45% | 17,323 | 79.4% |
[ 87.5% - 88.0% ] 87.90% | 4,562 | 51.0% |
[ 88.0% - 88.5% ] 88.19% | 40,300 | 41.6% |
[ 88.5% - 89.0% ] 88.88% | 7,068 | 45.7% |
[ 89.5% - 90.0% ] 89.97% | 13,876 | 57.1% |
[ 90.0% - 90.5% ] 90.35% | 147,165 | 70.6% |
[ 90.5% - 91.0% ] 90.80% | 33,138 | 58.2% |
[ 91.0% - 91.5% ] 91.25% | 189,184 | 64.3% |
[ 91.5% - 92.0% ] 91.58% | 606 | 23.8% |
[ 92.0% - 92.5% ] 92.08% | 51,852 | 64.8% |
[ 92.5% - 93.0% ] 92.66% | 25,965 | 42.2% |
[ 93.0% - 93.5% ] 93.15% | 110,548 | 70.7% |
[ 93.5% - 94.0% ] 93.63% | 30,160 | 63.1% |
[ 94.0% - 94.5% ] 94.10% | 281,717 | 57.6% |
[ 94.5% - 95.0% ] 94.81% | 238,676 | 54.7% |
[ 95.0% - 95.5% ] 95.25% | 311,824 | 56.7% |
[ 95.5% - 96.0% ] 95.73% | 149,189 | 53.7% |
[ 96.0% - 96.5% ] 96.18% | 329,088 | 52.3% |
[ 96.5% - 97.0% ] 96.73% | 352,386 | 49.1% |
[ 97.0% - 97.5% ] 97.19% | 196,560 | 48.8% |
[ 97.5% - 98.0% ] 97.73% | 522,681 | 47.9% |
[ 98.0% - 98.5% ] 98.27% | 376,077 | 47.7% |
[ 98.5% - 99.0% ] 98.78% | 508,516 | 44.7% |
[ 99.0% - 99.5% ] 99.17% | 450,589 | 45.3% |
[ 99.5% - 100.0% ] 99.83% | 237,495 | 40.8% |