Okinawan College, Under 1 year
COMPARE
Okinawan
Select to Compare
College, Under 1 year
Okinawan College, Under 1 year
73.7%
COLLEGE, UNDER 1 YEAR
100.0/ 100
METRIC RATING
7th/ 347
METRIC RANK
Okinawan College, Under 1 year Correlation Chart
The statistical analysis conducted on geographies consisting of 73,779,368 people shows no correlation between the proportion of Okinawans and percentage of population with at least college, under 1 year education in the United States with a correlation coefficient (R) of 0.007 and weighted average of 73.7%. On average, for every 1% (one percent) increase in Okinawans within a typical geography, there is an increase of 0.19% in percentage of population with at least college, under 1 year education.
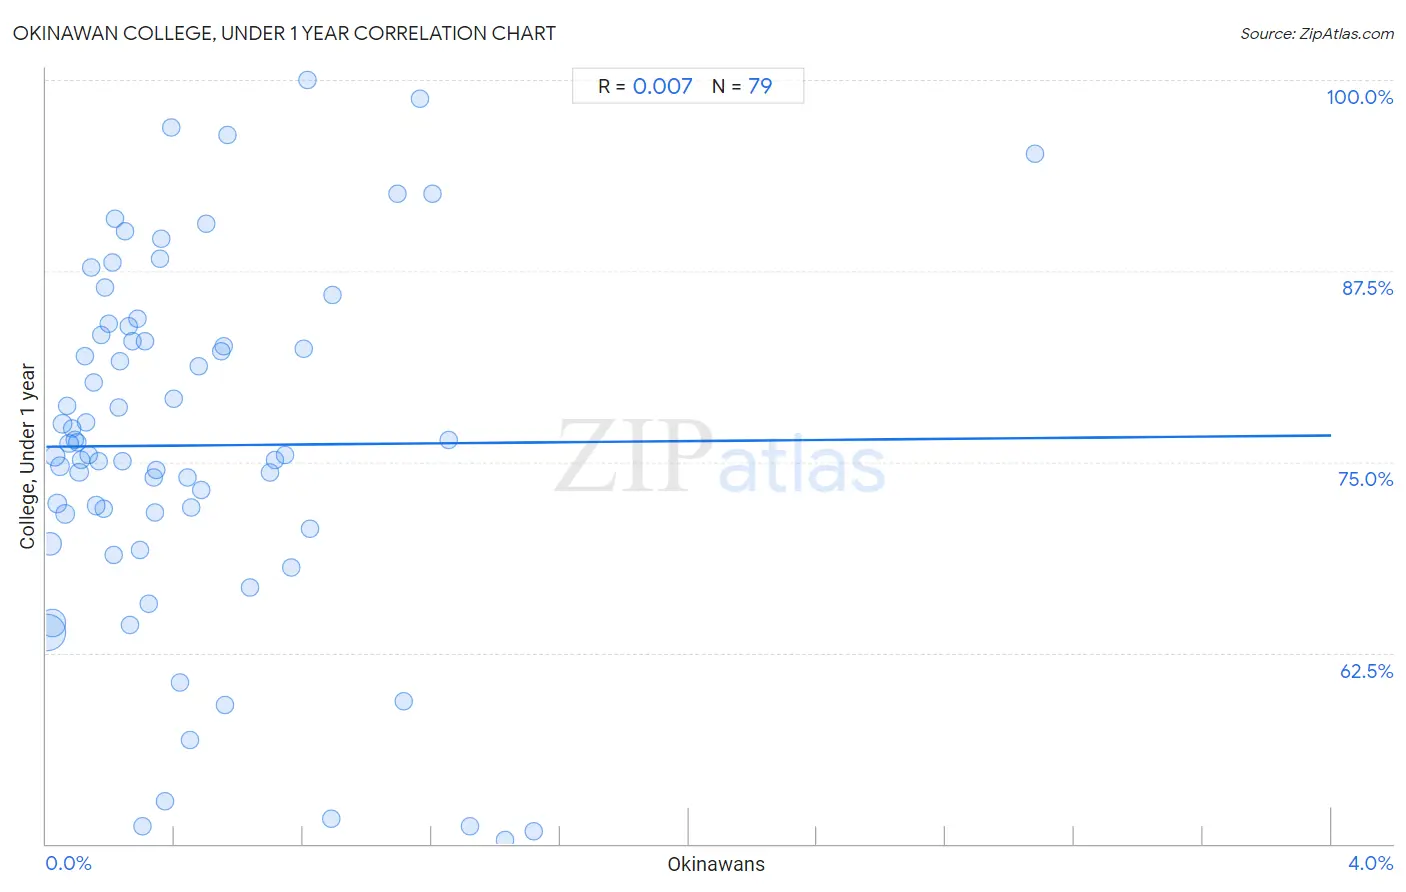
It is essential to understand that the correlation between the percentage of Okinawans and percentage of population with at least college, under 1 year education does not imply a direct cause-and-effect relationship. It remains uncertain whether the presence of Okinawans influences an upward or downward trend in the level of percentage of population with at least college, under 1 year education within an area, or if Okinawans simply ended up residing in those areas with higher or lower levels of percentage of population with at least college, under 1 year education due to other factors.
Demographics Similar to Okinawans by College, Under 1 year
In terms of college, under 1 year, the demographic groups most similar to Okinawans are Thai (73.4%, a difference of 0.33%), Immigrants from Taiwan (74.2%, a difference of 0.70%), Immigrants from Iran (74.3%, a difference of 0.80%), Immigrants from India (74.4%, a difference of 1.0%), and Immigrants from Australia (72.7%, a difference of 1.3%).
| Demographics | Rating | Rank | College, Under 1 year |
| Filipinos | 100.0 /100 | #1 | Exceptional 75.5% |
| Iranians | 100.0 /100 | #2 | Exceptional 74.9% |
| Immigrants from Singapore | 100.0 /100 | #3 | Exceptional 74.8% |
| Immigrants from India | 100.0 /100 | #4 | Exceptional 74.4% |
| Immigrants from Iran | 100.0 /100 | #5 | Exceptional 74.3% |
| Immigrants from Taiwan | 100.0 /100 | #6 | Exceptional 74.2% |
| Okinawans | 100.0 /100 | #7 | Exceptional 73.7% |
| Thais | 100.0 /100 | #8 | Exceptional 73.4% |
| Immigrants from Australia | 100.0 /100 | #9 | Exceptional 72.7% |
| Immigrants from Israel | 100.0 /100 | #10 | Exceptional 72.3% |
| Immigrants from South Central Asia | 100.0 /100 | #11 | Exceptional 72.1% |
| Immigrants from Sweden | 100.0 /100 | #12 | Exceptional 72.1% |
| Cypriots | 100.0 /100 | #13 | Exceptional 72.0% |
| Cambodians | 100.0 /100 | #14 | Exceptional 71.9% |
| Burmese | 100.0 /100 | #15 | Exceptional 71.9% |
Okinawan College, Under 1 year Correlation Summary
| Measurement | Okinawan Data | College, Under 1 year Data |
| Minimum | 0.0040% | 50.3% |
| Maximum | 3.1% | 100.0% |
| Range | 3.1% | 49.7% |
| Mean | 0.45% | 76.1% |
| Median | 0.31% | 75.5% |
| Interquartile 25% (IQ1) | 0.15% | 70.6% |
| Interquartile 75% (IQ3) | 0.56% | 83.3% |
| Interquartile Range (IQR) | 0.42% | 12.7% |
| Standard Deviation (Sample) | 0.47% | 11.7% |
| Standard Deviation (Population) | 0.47% | 11.7% |
Correlation Details
| Okinawan Percentile | Sample Size | College, Under 1 year |
[ 0.0% - 0.5% ] 0.0040% | 30,210,089 | 63.9% |
[ 0.0% - 0.5% ] 0.011% | 7,687,917 | 69.6% |
[ 0.0% - 0.5% ] 0.018% | 14,495,991 | 64.4% |
[ 0.0% - 0.5% ] 0.026% | 4,603,530 | 75.4% |
[ 0.0% - 0.5% ] 0.034% | 2,785,344 | 72.3% |
[ 0.0% - 0.5% ] 0.041% | 2,067,237 | 74.7% |
[ 0.0% - 0.5% ] 0.050% | 1,886,544 | 77.5% |
[ 0.0% - 0.5% ] 0.058% | 1,445,901 | 71.6% |
[ 0.0% - 0.5% ] 0.064% | 1,151,025 | 78.7% |
[ 0.0% - 0.5% ] 0.072% | 907,373 | 76.2% |
[ 0.0% - 0.5% ] 0.080% | 904,279 | 77.2% |
[ 0.0% - 0.5% ] 0.088% | 527,564 | 76.5% |
[ 0.0% - 0.5% ] 0.096% | 616,846 | 76.3% |
[ 0.0% - 0.5% ] 0.10% | 667,514 | 74.3% |
[ 0.0% - 0.5% ] 0.11% | 418,046 | 75.1% |
[ 0.0% - 0.5% ] 0.12% | 344,077 | 81.9% |
[ 0.0% - 0.5% ] 0.13% | 450,846 | 77.6% |
[ 0.0% - 0.5% ] 0.13% | 192,677 | 75.4% |
[ 0.0% - 0.5% ] 0.14% | 58,463 | 87.7% |
[ 0.0% - 0.5% ] 0.15% | 105,240 | 80.2% |
[ 0.0% - 0.5% ] 0.16% | 128,382 | 72.1% |
[ 0.0% - 0.5% ] 0.16% | 243,448 | 75.1% |
[ 0.0% - 0.5% ] 0.17% | 103,732 | 83.3% |
[ 0.0% - 0.5% ] 0.18% | 86,782 | 71.9% |
[ 0.0% - 0.5% ] 0.18% | 44,575 | 86.4% |
[ 0.0% - 0.5% ] 0.19% | 63,364 | 84.0% |
[ 0.0% - 0.5% ] 0.20% | 22,027 | 88.0% |
[ 0.0% - 0.5% ] 0.21% | 213,562 | 68.9% |
[ 0.0% - 0.5% ] 0.22% | 44,087 | 90.9% |
[ 0.0% - 0.5% ] 0.22% | 124,111 | 78.5% |
[ 0.0% - 0.5% ] 0.23% | 101,686 | 81.6% |
[ 0.0% - 0.5% ] 0.24% | 64,021 | 75.1% |
[ 0.0% - 0.5% ] 0.25% | 23,081 | 90.1% |
[ 0.0% - 0.5% ] 0.26% | 56,295 | 83.9% |
[ 0.0% - 0.5% ] 0.26% | 34,754 | 64.3% |
[ 0.0% - 0.5% ] 0.27% | 80,601 | 82.9% |
[ 0.0% - 0.5% ] 0.28% | 37,928 | 84.4% |
[ 0.0% - 0.5% ] 0.29% | 29,544 | 69.2% |
[ 0.0% - 0.5% ] 0.30% | 21,726 | 51.1% |
[ 0.0% - 0.5% ] 0.31% | 34,345 | 82.9% |
[ 0.0% - 0.5% ] 0.32% | 52,039 | 65.7% |
[ 0.0% - 0.5% ] 0.33% | 20,401 | 74.0% |
[ 0.0% - 0.5% ] 0.34% | 56,263 | 71.7% |
[ 0.0% - 0.5% ] 0.34% | 42,021 | 74.4% |
[ 0.0% - 0.5% ] 0.35% | 29,151 | 88.3% |
[ 0.0% - 0.5% ] 0.36% | 558 | 89.6% |
[ 0.0% - 0.5% ] 0.37% | 4,853 | 52.8% |
[ 0.0% - 0.5% ] 0.39% | 258 | 96.9% |
[ 0.0% - 0.5% ] 0.40% | 28,087 | 79.1% |
[ 0.0% - 0.5% ] 0.42% | 94,355 | 60.5% |
[ 0.0% - 0.5% ] 0.44% | 36,683 | 74.0% |
[ 0.0% - 0.5% ] 0.45% | 9,164 | 56.8% |
[ 0.0% - 0.5% ] 0.45% | 41,426 | 72.0% |
[ 0.0% - 0.5% ] 0.47% | 16,067 | 81.2% |
[ 0.0% - 0.5% ] 0.48% | 4,575 | 73.2% |
[ 0.0% - 0.5% ] 0.50% | 20,706 | 90.6% |
[ 0.5% - 1.0% ] 0.55% | 8,073 | 82.2% |
[ 0.5% - 1.0% ] 0.55% | 58,158 | 82.5% |
[ 0.5% - 1.0% ] 0.56% | 4,141 | 59.1% |
[ 0.5% - 1.0% ] 0.56% | 1,065 | 96.4% |
[ 0.5% - 1.0% ] 0.63% | 315 | 66.8% |
[ 0.5% - 1.0% ] 0.70% | 27,212 | 74.3% |
[ 0.5% - 1.0% ] 0.71% | 4,771 | 75.2% |
[ 0.5% - 1.0% ] 0.74% | 2,022 | 75.5% |
[ 0.5% - 1.0% ] 0.76% | 46,553 | 68.1% |
[ 0.5% - 1.0% ] 0.80% | 2,125 | 82.4% |
[ 0.5% - 1.0% ] 0.81% | 3,317 | 100.0% |
[ 0.5% - 1.0% ] 0.82% | 5,593 | 70.6% |
[ 0.5% - 1.0% ] 0.89% | 21,206 | 51.6% |
[ 0.5% - 1.0% ] 0.89% | 3,814 | 86.0% |
[ 1.0% - 1.5% ] 1.10% | 18,077 | 92.5% |
[ 1.0% - 1.5% ] 1.11% | 180 | 59.3% |
[ 1.0% - 1.5% ] 1.16% | 4,474 | 98.8% |
[ 1.0% - 1.5% ] 1.20% | 16,447 | 92.5% |
[ 1.0% - 1.5% ] 1.25% | 1,598 | 76.4% |
[ 1.0% - 1.5% ] 1.32% | 1,364 | 51.1% |
[ 1.0% - 1.5% ] 1.43% | 3,571 | 50.3% |
[ 1.5% - 2.0% ] 1.52% | 395 | 50.8% |
[ 3.0% - 3.5% ] 3.08% | 3,736 | 95.2% |