Okinawan 3 or more Vehicles in Household
COMPARE
Okinawan
Select to Compare
3 or more Vehicles in Household
Okinawan 3 or more Vehicles in Household
17.4%
3+ VEHICLES AVAILABLE
0.4/ 100
METRIC RATING
276th/ 347
METRIC RANK
Okinawan 3 or more Vehicles in Household Correlation Chart
The statistical analysis conducted on geographies consisting of 73,703,163 people shows a weak positive correlation between the proportion of Okinawans and percentage of households with 3 or more vehicles available in the United States with a correlation coefficient (R) of 0.277 and weighted average of 17.4%. On average, for every 1% (one percent) increase in Okinawans within a typical geography, there is an increase of 8.0% in percentage of households with 3 or more vehicles available.
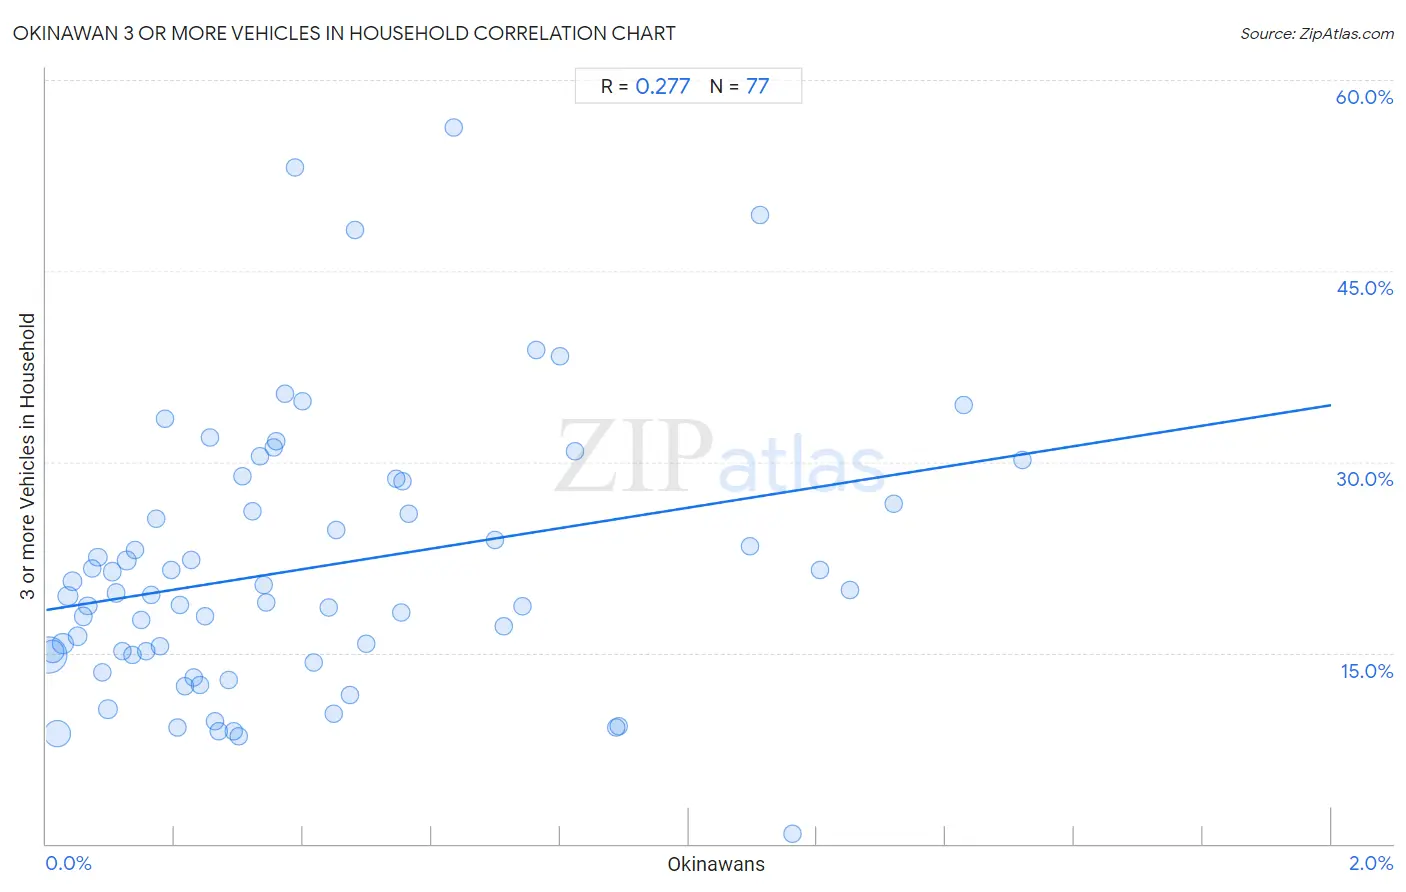
It is essential to understand that the correlation between the percentage of Okinawans and percentage of households with 3 or more vehicles available does not imply a direct cause-and-effect relationship. It remains uncertain whether the presence of Okinawans influences an upward or downward trend in the level of percentage of households with 3 or more vehicles available within an area, or if Okinawans simply ended up residing in those areas with higher or lower levels of percentage of households with 3 or more vehicles available due to other factors.
Demographics Similar to Okinawans by 3 or more Vehicles in Household
In terms of 3 or more vehicles in household, the demographic groups most similar to Okinawans are Brazilian (17.4%, a difference of 0.14%), Immigrants from Ukraine (17.5%, a difference of 0.16%), Immigrants from Bahamas (17.4%, a difference of 0.23%), Immigrants from Kazakhstan (17.4%, a difference of 0.25%), and Immigrants from Eastern Europe (17.4%, a difference of 0.29%).
| Demographics | Rating | Rank | 3 or more Vehicles in Household |
| Immigrants from France | 0.6 /100 | #269 | Tragic 17.6% |
| Immigrants from Nepal | 0.6 /100 | #270 | Tragic 17.6% |
| South Americans | 0.6 /100 | #271 | Tragic 17.6% |
| Immigrants from Africa | 0.5 /100 | #272 | Tragic 17.6% |
| Immigrants from Sudan | 0.5 /100 | #273 | Tragic 17.6% |
| Immigrants from Bosnia and Herzegovina | 0.5 /100 | #274 | Tragic 17.5% |
| Immigrants from Ukraine | 0.4 /100 | #275 | Tragic 17.5% |
| Okinawans | 0.4 /100 | #276 | Tragic 17.4% |
| Brazilians | 0.4 /100 | #277 | Tragic 17.4% |
| Immigrants from Bahamas | 0.3 /100 | #278 | Tragic 17.4% |
| Immigrants from Kazakhstan | 0.3 /100 | #279 | Tragic 17.4% |
| Immigrants from Eastern Europe | 0.3 /100 | #280 | Tragic 17.4% |
| Immigrants from Latvia | 0.3 /100 | #281 | Tragic 17.4% |
| Immigrants from Ireland | 0.3 /100 | #282 | Tragic 17.3% |
| Blacks/African Americans | 0.3 /100 | #283 | Tragic 17.3% |
Okinawan 3 or more Vehicles in Household Correlation Summary
| Measurement | Okinawan Data | 3 or more Vehicles in Household Data |
| Minimum | 0.0040% | 0.75% |
| Maximum | 1.5% | 56.2% |
| Range | 1.5% | 55.5% |
| Mean | 0.41% | 21.7% |
| Median | 0.30% | 19.5% |
| Interquartile 25% (IQ1) | 0.14% | 14.8% |
| Interquartile 75% (IQ3) | 0.55% | 27.6% |
| Interquartile Range (IQR) | 0.41% | 12.8% |
| Standard Deviation (Sample) | 0.37% | 10.7% |
| Standard Deviation (Population) | 0.37% | 10.6% |
Correlation Details
| Okinawan Percentile | Sample Size | 3 or more Vehicles in Household |
[ 0.0% - 0.5% ] 0.0040% | 30,210,089 | 14.8% |
[ 0.0% - 0.5% ] 0.011% | 7,687,917 | 15.1% |
[ 0.0% - 0.5% ] 0.018% | 14,495,991 | 8.7% |
[ 0.0% - 0.5% ] 0.026% | 4,603,530 | 15.7% |
[ 0.0% - 0.5% ] 0.034% | 2,764,260 | 19.4% |
[ 0.0% - 0.5% ] 0.041% | 2,067,237 | 20.7% |
[ 0.0% - 0.5% ] 0.050% | 1,886,544 | 16.3% |
[ 0.0% - 0.5% ] 0.058% | 1,435,388 | 17.8% |
[ 0.0% - 0.5% ] 0.064% | 1,151,025 | 18.7% |
[ 0.0% - 0.5% ] 0.072% | 907,373 | 21.6% |
[ 0.0% - 0.5% ] 0.080% | 904,279 | 22.5% |
[ 0.0% - 0.5% ] 0.088% | 527,564 | 13.5% |
[ 0.0% - 0.5% ] 0.096% | 616,846 | 10.6% |
[ 0.0% - 0.5% ] 0.10% | 667,514 | 21.4% |
[ 0.0% - 0.5% ] 0.11% | 418,046 | 19.7% |
[ 0.0% - 0.5% ] 0.12% | 344,077 | 15.1% |
[ 0.0% - 0.5% ] 0.13% | 450,846 | 22.3% |
[ 0.0% - 0.5% ] 0.13% | 189,717 | 14.8% |
[ 0.0% - 0.5% ] 0.14% | 58,463 | 23.1% |
[ 0.0% - 0.5% ] 0.15% | 105,240 | 17.6% |
[ 0.0% - 0.5% ] 0.15% | 121,399 | 15.1% |
[ 0.0% - 0.5% ] 0.16% | 243,448 | 19.5% |
[ 0.0% - 0.5% ] 0.17% | 103,732 | 25.5% |
[ 0.0% - 0.5% ] 0.18% | 82,278 | 15.5% |
[ 0.0% - 0.5% ] 0.18% | 44,575 | 33.4% |
[ 0.0% - 0.5% ] 0.19% | 63,364 | 21.5% |
[ 0.0% - 0.5% ] 0.20% | 22,027 | 9.2% |
[ 0.0% - 0.5% ] 0.21% | 202,483 | 18.7% |
[ 0.0% - 0.5% ] 0.22% | 44,087 | 12.4% |
[ 0.0% - 0.5% ] 0.22% | 122,346 | 22.3% |
[ 0.0% - 0.5% ] 0.23% | 101,686 | 13.1% |
[ 0.0% - 0.5% ] 0.24% | 64,021 | 12.5% |
[ 0.0% - 0.5% ] 0.25% | 23,081 | 17.9% |
[ 0.0% - 0.5% ] 0.26% | 56,295 | 31.9% |
[ 0.0% - 0.5% ] 0.26% | 34,754 | 9.6% |
[ 0.0% - 0.5% ] 0.27% | 79,138 | 8.8% |
[ 0.0% - 0.5% ] 0.28% | 37,928 | 12.9% |
[ 0.0% - 0.5% ] 0.29% | 29,544 | 8.9% |
[ 0.0% - 0.5% ] 0.30% | 21,726 | 8.4% |
[ 0.0% - 0.5% ] 0.31% | 25,544 | 28.9% |
[ 0.0% - 0.5% ] 0.32% | 52,039 | 26.1% |
[ 0.0% - 0.5% ] 0.33% | 20,401 | 30.4% |
[ 0.0% - 0.5% ] 0.34% | 56,263 | 20.3% |
[ 0.0% - 0.5% ] 0.34% | 42,021 | 18.9% |
[ 0.0% - 0.5% ] 0.35% | 29,151 | 31.2% |
[ 0.0% - 0.5% ] 0.36% | 558 | 31.6% |
[ 0.0% - 0.5% ] 0.37% | 4,853 | 35.3% |
[ 0.0% - 0.5% ] 0.39% | 258 | 53.1% |
[ 0.0% - 0.5% ] 0.40% | 28,087 | 34.7% |
[ 0.0% - 0.5% ] 0.42% | 94,355 | 14.3% |
[ 0.0% - 0.5% ] 0.44% | 36,683 | 18.6% |
[ 0.0% - 0.5% ] 0.45% | 9,164 | 10.2% |
[ 0.0% - 0.5% ] 0.45% | 41,426 | 24.6% |
[ 0.0% - 0.5% ] 0.47% | 16,067 | 11.7% |
[ 0.0% - 0.5% ] 0.48% | 4,575 | 48.2% |
[ 0.0% - 0.5% ] 0.50% | 20,706 | 15.7% |
[ 0.5% - 1.0% ] 0.55% | 8,073 | 28.7% |
[ 0.5% - 1.0% ] 0.55% | 58,158 | 18.2% |
[ 0.5% - 1.0% ] 0.56% | 4,141 | 28.5% |
[ 0.5% - 1.0% ] 0.56% | 1,065 | 25.9% |
[ 0.5% - 1.0% ] 0.63% | 315 | 56.2% |
[ 0.5% - 1.0% ] 0.70% | 27,212 | 23.8% |
[ 0.5% - 1.0% ] 0.71% | 4,771 | 17.1% |
[ 0.5% - 1.0% ] 0.74% | 2,022 | 18.7% |
[ 0.5% - 1.0% ] 0.76% | 46,553 | 38.8% |
[ 0.5% - 1.0% ] 0.80% | 2,125 | 38.3% |
[ 0.5% - 1.0% ] 0.82% | 5,593 | 30.8% |
[ 0.5% - 1.0% ] 0.89% | 21,206 | 9.1% |
[ 0.5% - 1.0% ] 0.89% | 3,814 | 9.2% |
[ 1.0% - 1.5% ] 1.10% | 18,077 | 23.3% |
[ 1.0% - 1.5% ] 1.11% | 180 | 49.4% |
[ 1.0% - 1.5% ] 1.16% | 4,474 | 0.75% |
[ 1.0% - 1.5% ] 1.20% | 16,447 | 21.5% |
[ 1.0% - 1.5% ] 1.25% | 1,598 | 19.9% |
[ 1.0% - 1.5% ] 1.32% | 1,364 | 26.7% |
[ 1.0% - 1.5% ] 1.43% | 3,571 | 34.5% |
[ 1.5% - 2.0% ] 1.52% | 395 | 30.2% |