Okinawan Married-couple Households
COMPARE
Okinawan
Select to Compare
Married-couple Households
Okinawan Married-couple Households
47.4%
MARRIED-COUPLE HOUSEHOLDS
90.1/ 100
METRIC RATING
122nd/ 347
METRIC RANK
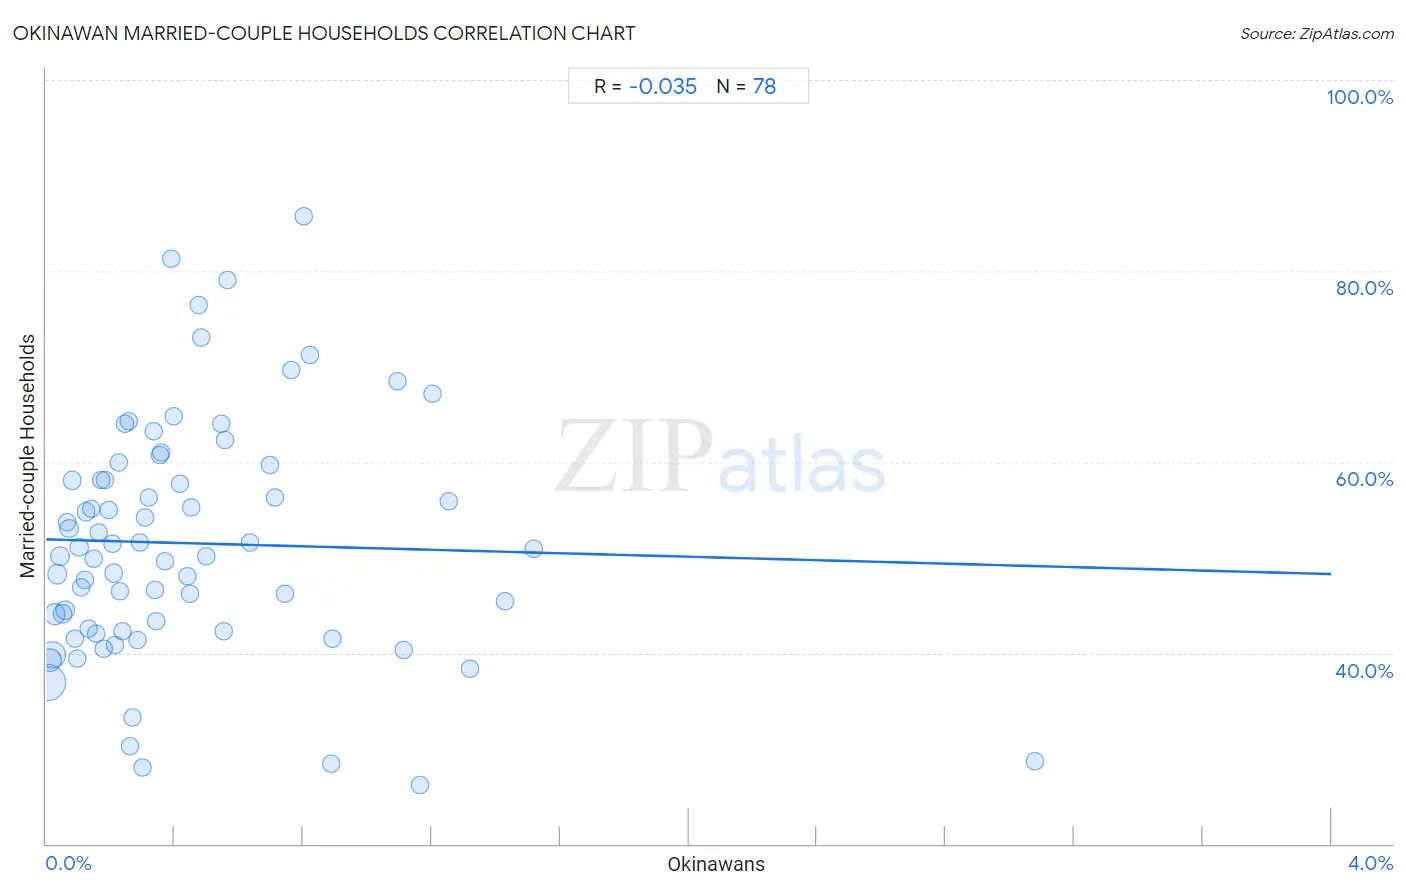
Okinawan Married-couple Households Correlation Chart
The statistical analysis conducted on geographies consisting of 73,726,117 people shows no correlation between the proportion of Okinawans and percentage of married-couple family households in the United States with a correlation coefficient (R) of -0.035 and weighted average of 47.4%. On average, for every 1% (one percent) increase in Okinawans within a typical geography, there is a decrease of 0.91% in percentage of married-couple family households.
It is essential to understand that the correlation between the percentage of Okinawans and percentage of married-couple family households does not imply a direct cause-and-effect relationship. It remains uncertain whether the presence of Okinawans influences an upward or downward trend in the level of percentage of married-couple family households within an area, or if Okinawans simply ended up residing in those areas with higher or lower levels of percentage of married-couple family households due to other factors.
Demographics Similar to Okinawans by Married-couple Households
In terms of married-couple households, the demographic groups most similar to Okinawans are Immigrants from Eastern Europe (47.4%, a difference of 0.020%), Puget Sound Salish (47.4%, a difference of 0.040%), Immigrants from Venezuela (47.4%, a difference of 0.080%), Zimbabwean (47.4%, a difference of 0.090%), and Australian (47.4%, a difference of 0.11%).
| Demographics | Rating | Rank | Married-couple Households |
| Slovaks | 92.9 /100 | #115 | Exceptional 47.6% |
| Argentineans | 92.5 /100 | #116 | Exceptional 47.5% |
| French Canadians | 92.4 /100 | #117 | Exceptional 47.5% |
| Immigrants from Germany | 92.4 /100 | #118 | Exceptional 47.5% |
| Chileans | 92.2 /100 | #119 | Exceptional 47.5% |
| Puget Sound Salish | 90.5 /100 | #120 | Exceptional 47.4% |
| Immigrants from Eastern Europe | 90.3 /100 | #121 | Exceptional 47.4% |
| Okinawans | 90.1 /100 | #122 | Exceptional 47.4% |
| Immigrants from Venezuela | 89.3 /100 | #123 | Excellent 47.4% |
| Zimbabweans | 89.2 /100 | #124 | Excellent 47.4% |
| Australians | 89.0 /100 | #125 | Excellent 47.4% |
| Pakistanis | 88.6 /100 | #126 | Excellent 47.3% |
| Celtics | 88.1 /100 | #127 | Excellent 47.3% |
| Immigrants from Peru | 87.9 /100 | #128 | Excellent 47.3% |
| Immigrants from Iraq | 87.8 /100 | #129 | Excellent 47.3% |
Okinawan Married-couple Households Correlation Summary
| Measurement | Okinawan Data | Married-couple Households Data |
| Minimum | 0.0040% | 26.1% |
| Maximum | 3.1% | 85.7% |
| Range | 3.1% | 59.6% |
| Mean | 0.45% | 51.5% |
| Median | 0.30% | 50.5% |
| Interquartile 25% (IQ1) | 0.15% | 42.3% |
| Interquartile 75% (IQ3) | 0.56% | 58.1% |
| Interquartile Range (IQR) | 0.41% | 15.9% |
| Standard Deviation (Sample) | 0.47% | 12.5% |
| Standard Deviation (Population) | 0.47% | 12.4% |
Correlation Details
| Okinawan Percentile | Sample Size | Married-couple Households |
[ 0.0% - 0.5% ] 0.0040% | 30,210,089 | 36.9% |
[ 0.0% - 0.5% ] 0.011% | 7,687,917 | 39.2% |
[ 0.0% - 0.5% ] 0.018% | 14,495,991 | 39.8% |
[ 0.0% - 0.5% ] 0.026% | 4,603,530 | 44.0% |
[ 0.0% - 0.5% ] 0.034% | 2,764,260 | 48.2% |
[ 0.0% - 0.5% ] 0.041% | 2,067,237 | 50.1% |
[ 0.0% - 0.5% ] 0.050% | 1,886,544 | 44.1% |
[ 0.0% - 0.5% ] 0.058% | 1,435,388 | 44.5% |
[ 0.0% - 0.5% ] 0.064% | 1,151,025 | 53.7% |
[ 0.0% - 0.5% ] 0.072% | 907,373 | 53.0% |
[ 0.0% - 0.5% ] 0.080% | 904,279 | 58.1% |
[ 0.0% - 0.5% ] 0.088% | 527,564 | 41.4% |
[ 0.0% - 0.5% ] 0.096% | 616,846 | 39.4% |
[ 0.0% - 0.5% ] 0.10% | 667,514 | 51.1% |
[ 0.0% - 0.5% ] 0.11% | 418,046 | 46.9% |
[ 0.0% - 0.5% ] 0.12% | 344,077 | 47.6% |
[ 0.0% - 0.5% ] 0.13% | 450,846 | 54.8% |
[ 0.0% - 0.5% ] 0.13% | 189,717 | 42.5% |
[ 0.0% - 0.5% ] 0.14% | 58,463 | 55.1% |
[ 0.0% - 0.5% ] 0.15% | 105,240 | 49.8% |
[ 0.0% - 0.5% ] 0.16% | 128,382 | 42.0% |
[ 0.0% - 0.5% ] 0.16% | 243,448 | 52.6% |
[ 0.0% - 0.5% ] 0.17% | 103,732 | 58.1% |
[ 0.0% - 0.5% ] 0.18% | 82,278 | 40.4% |
[ 0.0% - 0.5% ] 0.18% | 44,575 | 58.1% |
[ 0.0% - 0.5% ] 0.19% | 63,364 | 54.9% |
[ 0.0% - 0.5% ] 0.20% | 22,027 | 51.5% |
[ 0.0% - 0.5% ] 0.21% | 208,753 | 48.4% |
[ 0.0% - 0.5% ] 0.22% | 44,087 | 40.8% |
[ 0.0% - 0.5% ] 0.22% | 122,346 | 59.9% |
[ 0.0% - 0.5% ] 0.23% | 97,387 | 46.4% |
[ 0.0% - 0.5% ] 0.24% | 64,021 | 42.3% |
[ 0.0% - 0.5% ] 0.25% | 23,081 | 64.0% |
[ 0.0% - 0.5% ] 0.26% | 56,295 | 64.2% |
[ 0.0% - 0.5% ] 0.26% | 34,754 | 30.2% |
[ 0.0% - 0.5% ] 0.27% | 80,601 | 33.2% |
[ 0.0% - 0.5% ] 0.28% | 37,928 | 41.3% |
[ 0.0% - 0.5% ] 0.29% | 29,544 | 51.5% |
[ 0.0% - 0.5% ] 0.30% | 21,726 | 27.9% |
[ 0.0% - 0.5% ] 0.31% | 34,345 | 54.2% |
[ 0.0% - 0.5% ] 0.32% | 52,039 | 56.3% |
[ 0.0% - 0.5% ] 0.33% | 20,401 | 63.3% |
[ 0.0% - 0.5% ] 0.34% | 56,263 | 46.6% |
[ 0.0% - 0.5% ] 0.34% | 42,021 | 43.4% |
[ 0.0% - 0.5% ] 0.35% | 29,151 | 60.7% |
[ 0.0% - 0.5% ] 0.36% | 558 | 60.9% |
[ 0.0% - 0.5% ] 0.37% | 4,853 | 49.5% |
[ 0.0% - 0.5% ] 0.39% | 258 | 81.2% |
[ 0.0% - 0.5% ] 0.40% | 28,087 | 64.7% |
[ 0.0% - 0.5% ] 0.42% | 94,355 | 57.7% |
[ 0.0% - 0.5% ] 0.44% | 36,683 | 48.0% |
[ 0.0% - 0.5% ] 0.45% | 9,164 | 46.2% |
[ 0.0% - 0.5% ] 0.45% | 41,426 | 55.3% |
[ 0.0% - 0.5% ] 0.47% | 16,067 | 76.4% |
[ 0.0% - 0.5% ] 0.48% | 4,575 | 73.0% |
[ 0.0% - 0.5% ] 0.50% | 20,706 | 50.1% |
[ 0.5% - 1.0% ] 0.55% | 8,073 | 64.0% |
[ 0.5% - 1.0% ] 0.55% | 58,158 | 42.2% |
[ 0.5% - 1.0% ] 0.56% | 4,141 | 62.3% |
[ 0.5% - 1.0% ] 0.56% | 1,065 | 79.1% |
[ 0.5% - 1.0% ] 0.63% | 315 | 51.6% |
[ 0.5% - 1.0% ] 0.70% | 27,212 | 59.7% |
[ 0.5% - 1.0% ] 0.71% | 4,771 | 56.3% |
[ 0.5% - 1.0% ] 0.74% | 2,022 | 46.2% |
[ 0.5% - 1.0% ] 0.76% | 46,553 | 69.6% |
[ 0.5% - 1.0% ] 0.80% | 2,125 | 85.7% |
[ 0.5% - 1.0% ] 0.82% | 5,593 | 71.2% |
[ 0.5% - 1.0% ] 0.89% | 21,206 | 28.4% |
[ 0.5% - 1.0% ] 0.89% | 3,814 | 41.4% |
[ 1.0% - 1.5% ] 1.10% | 18,077 | 68.5% |
[ 1.0% - 1.5% ] 1.11% | 180 | 40.3% |
[ 1.0% - 1.5% ] 1.16% | 4,474 | 26.1% |
[ 1.0% - 1.5% ] 1.20% | 16,447 | 67.2% |
[ 1.0% - 1.5% ] 1.25% | 1,598 | 55.9% |
[ 1.0% - 1.5% ] 1.32% | 1,364 | 38.4% |
[ 1.0% - 1.5% ] 1.43% | 3,571 | 45.5% |
[ 1.5% - 2.0% ] 1.52% | 395 | 50.9% |
[ 3.0% - 3.5% ] 3.08% | 3,736 | 28.6% |