Immigrants from Singapore Married-couple Households
COMPARE
Immigrants from Singapore
Select to Compare
Married-couple Households
Immigrants from Singapore Married-couple Households
48.3%
MARRIED-COUPLE HOUSEHOLDS
98.6/ 100
METRIC RATING
73rd/ 347
METRIC RANK
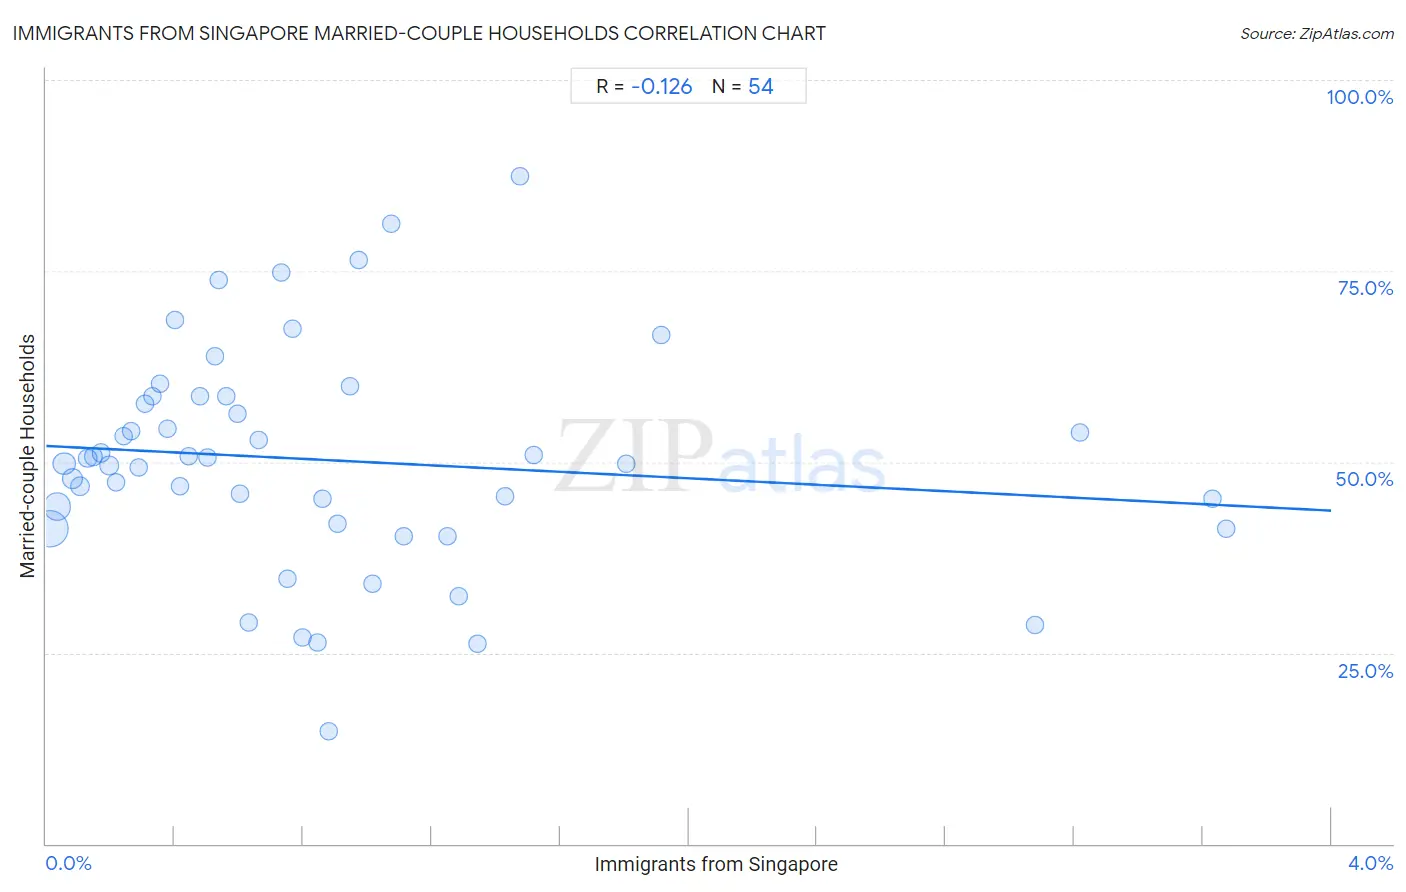
Immigrants from Singapore Married-couple Households Correlation Chart
The statistical analysis conducted on geographies consisting of 137,440,387 people shows a poor negative correlation between the proportion of Immigrants from Singapore and percentage of married-couple family households in the United States with a correlation coefficient (R) of -0.126 and weighted average of 48.3%. On average, for every 1% (one percent) increase in Immigrants from Singapore within a typical geography, there is a decrease of 2.1% in percentage of married-couple family households.
It is essential to understand that the correlation between the percentage of Immigrants from Singapore and percentage of married-couple family households does not imply a direct cause-and-effect relationship. It remains uncertain whether the presence of Immigrants from Singapore influences an upward or downward trend in the level of percentage of married-couple family households within an area, or if Immigrants from Singapore simply ended up residing in those areas with higher or lower levels of percentage of married-couple family households due to other factors.
Demographics Similar to Immigrants from Singapore by Married-couple Households
In terms of married-couple households, the demographic groups most similar to Immigrants from Singapore are Immigrants from Romania (48.3%, a difference of 0.010%), Scotch-Irish (48.3%, a difference of 0.020%), Immigrants from England (48.2%, a difference of 0.10%), Immigrants from Fiji (48.2%, a difference of 0.10%), and Laotian (48.4%, a difference of 0.19%).
| Demographics | Rating | Rank | Married-couple Households |
| Jordanians | 98.9 /100 | #66 | Exceptional 48.4% |
| Romanians | 98.9 /100 | #67 | Exceptional 48.4% |
| Immigrants from South Eastern Asia | 98.9 /100 | #68 | Exceptional 48.4% |
| Immigrants from China | 98.9 /100 | #69 | Exceptional 48.4% |
| Immigrants from North America | 98.9 /100 | #70 | Exceptional 48.4% |
| Laotians | 98.8 /100 | #71 | Exceptional 48.4% |
| Scotch-Irish | 98.6 /100 | #72 | Exceptional 48.3% |
| Immigrants from Singapore | 98.6 /100 | #73 | Exceptional 48.3% |
| Immigrants from Romania | 98.6 /100 | #74 | Exceptional 48.3% |
| Immigrants from England | 98.4 /100 | #75 | Exceptional 48.2% |
| Immigrants from Fiji | 98.4 /100 | #76 | Exceptional 48.2% |
| Canadians | 98.2 /100 | #77 | Exceptional 48.2% |
| Egyptians | 98.2 /100 | #78 | Exceptional 48.2% |
| Immigrants from Netherlands | 98.2 /100 | #79 | Exceptional 48.2% |
| Russians | 98.1 /100 | #80 | Exceptional 48.2% |
Immigrants from Singapore Married-couple Households Correlation Summary
| Measurement | Immigrants from Singapore Data | Married-couple Households Data |
| Minimum | 0.011% | 14.8% |
| Maximum | 3.7% | 87.3% |
| Range | 3.7% | 72.5% |
| Mean | 0.87% | 50.2% |
| Median | 0.62% | 50.1% |
| Interquartile 25% (IQ1) | 0.31% | 41.8% |
| Interquartile 75% (IQ3) | 1.1% | 58.6% |
| Interquartile Range (IQR) | 0.76% | 16.7% |
| Standard Deviation (Sample) | 0.86% | 14.5% |
| Standard Deviation (Population) | 0.85% | 14.3% |
Correlation Details
| Immigrants from Singapore Percentile | Sample Size | Married-couple Households |
[ 0.0% - 0.5% ] 0.011% | 65,010,269 | 41.3% |
[ 0.0% - 0.5% ] 0.033% | 32,518,067 | 44.2% |
[ 0.0% - 0.5% ] 0.056% | 13,827,368 | 49.7% |
[ 0.0% - 0.5% ] 0.080% | 8,978,294 | 47.8% |
[ 0.0% - 0.5% ] 0.10% | 4,213,494 | 46.8% |
[ 0.0% - 0.5% ] 0.13% | 3,194,729 | 50.5% |
[ 0.0% - 0.5% ] 0.15% | 2,378,019 | 50.7% |
[ 0.0% - 0.5% ] 0.17% | 1,264,126 | 51.1% |
[ 0.0% - 0.5% ] 0.20% | 1,191,584 | 49.5% |
[ 0.0% - 0.5% ] 0.22% | 1,178,213 | 47.3% |
[ 0.0% - 0.5% ] 0.24% | 834,796 | 53.3% |
[ 0.0% - 0.5% ] 0.26% | 644,658 | 54.0% |
[ 0.0% - 0.5% ] 0.29% | 449,062 | 49.3% |
[ 0.0% - 0.5% ] 0.31% | 258,045 | 57.6% |
[ 0.0% - 0.5% ] 0.33% | 214,453 | 58.6% |
[ 0.0% - 0.5% ] 0.35% | 51,876 | 60.2% |
[ 0.0% - 0.5% ] 0.38% | 192,754 | 54.3% |
[ 0.0% - 0.5% ] 0.40% | 87,319 | 68.5% |
[ 0.0% - 0.5% ] 0.42% | 85,662 | 46.7% |
[ 0.0% - 0.5% ] 0.44% | 154,009 | 50.7% |
[ 0.0% - 0.5% ] 0.48% | 68,561 | 58.6% |
[ 0.5% - 1.0% ] 0.50% | 74,105 | 50.6% |
[ 0.5% - 1.0% ] 0.53% | 86,272 | 63.9% |
[ 0.5% - 1.0% ] 0.54% | 18,866 | 73.9% |
[ 0.5% - 1.0% ] 0.56% | 56,293 | 58.7% |
[ 0.5% - 1.0% ] 0.60% | 59,632 | 56.2% |
[ 0.5% - 1.0% ] 0.60% | 31,978 | 45.9% |
[ 0.5% - 1.0% ] 0.63% | 44,965 | 28.9% |
[ 0.5% - 1.0% ] 0.66% | 10,285 | 52.9% |
[ 0.5% - 1.0% ] 0.73% | 6,972 | 74.7% |
[ 0.5% - 1.0% ] 0.75% | 2,136 | 34.7% |
[ 0.5% - 1.0% ] 0.77% | 69,385 | 67.4% |
[ 0.5% - 1.0% ] 0.80% | 16,903 | 27.0% |
[ 0.5% - 1.0% ] 0.84% | 3,676 | 26.4% |
[ 0.5% - 1.0% ] 0.86% | 27,042 | 45.2% |
[ 0.5% - 1.0% ] 0.88% | 12,039 | 14.8% |
[ 0.5% - 1.0% ] 0.90% | 22,106 | 41.8% |
[ 0.5% - 1.0% ] 0.95% | 31,185 | 59.9% |
[ 0.5% - 1.0% ] 0.97% | 2,464 | 76.5% |
[ 1.0% - 1.5% ] 1.02% | 10,517 | 34.0% |
[ 1.0% - 1.5% ] 1.07% | 10,534 | 81.1% |
[ 1.0% - 1.5% ] 1.11% | 180 | 40.3% |
[ 1.0% - 1.5% ] 1.25% | 17,624 | 40.3% |
[ 1.0% - 1.5% ] 1.28% | 3,426 | 32.4% |
[ 1.0% - 1.5% ] 1.34% | 4,474 | 26.1% |
[ 1.0% - 1.5% ] 1.43% | 3,571 | 45.5% |
[ 1.0% - 1.5% ] 1.48% | 6,368 | 87.3% |
[ 1.5% - 2.0% ] 1.52% | 395 | 50.9% |
[ 1.5% - 2.0% ] 1.80% | 1,219 | 49.7% |
[ 1.5% - 2.0% ] 1.91% | 2,089 | 66.7% |
[ 3.0% - 3.5% ] 3.08% | 3,736 | 28.6% |
[ 3.0% - 3.5% ] 3.22% | 3,169 | 53.8% |
[ 3.5% - 4.0% ] 3.63% | 606 | 45.2% |
[ 3.5% - 4.0% ] 3.67% | 817 | 41.2% |