Immigrants from Singapore 4 or more Vehicles in Household
COMPARE
Immigrants from Singapore
Select to Compare
4 or more Vehicles in Household
Immigrants from Singapore 4 or more Vehicles in Household
5.9%
4+ VEHICLES AVAILABLE
7.9/ 100
METRIC RATING
226th/ 347
METRIC RANK
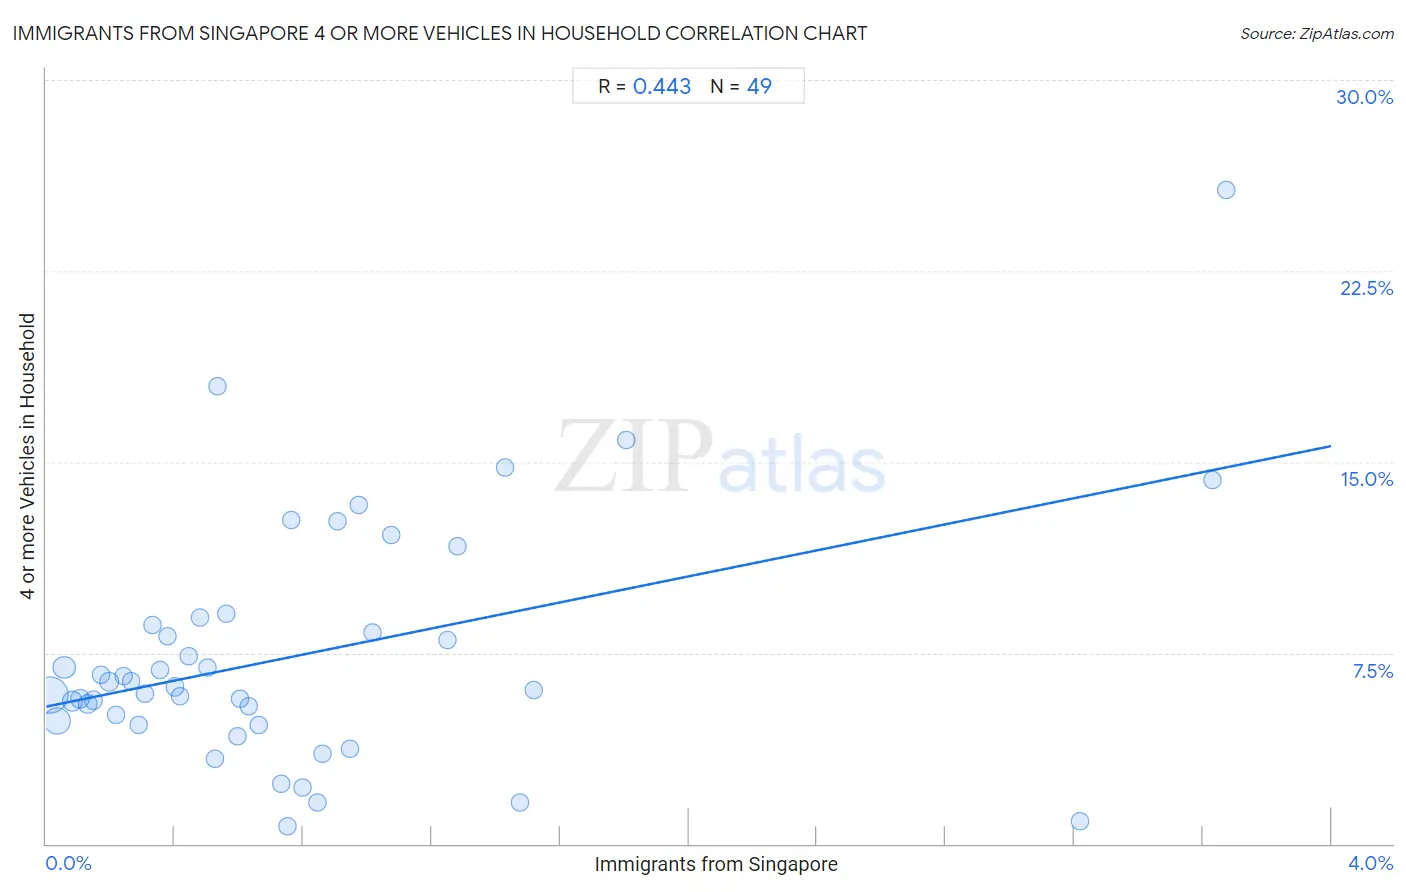
Immigrants from Singapore 4 or more Vehicles in Household Correlation Chart
The statistical analysis conducted on geographies consisting of 136,732,831 people shows a moderate positive correlation between the proportion of Immigrants from Singapore and percentage of households with 4 or more vehicles available in the United States with a correlation coefficient (R) of 0.443 and weighted average of 5.9%. On average, for every 1% (one percent) increase in Immigrants from Singapore within a typical geography, there is an increase of 2.6% in percentage of households with 4 or more vehicles available.
It is essential to understand that the correlation between the percentage of Immigrants from Singapore and percentage of households with 4 or more vehicles available does not imply a direct cause-and-effect relationship. It remains uncertain whether the presence of Immigrants from Singapore influences an upward or downward trend in the level of percentage of households with 4 or more vehicles available within an area, or if Immigrants from Singapore simply ended up residing in those areas with higher or lower levels of percentage of households with 4 or more vehicles available due to other factors.
Demographics Similar to Immigrants from Singapore by 4 or more Vehicles in Household
In terms of 4 or more vehicles in household, the demographic groups most similar to Immigrants from Singapore are Immigrants from Western Asia (5.9%, a difference of 0.040%), Immigrants from Uganda (5.9%, a difference of 0.13%), Indonesian (6.0%, a difference of 0.38%), Eastern European (5.9%, a difference of 0.41%), and Cuban (6.0%, a difference of 0.46%).
| Demographics | Rating | Rank | 4 or more Vehicles in Household |
| Serbians | 11.0 /100 | #219 | Poor 6.0% |
| Russians | 10.3 /100 | #220 | Poor 6.0% |
| Immigrants from Moldova | 9.3 /100 | #221 | Tragic 6.0% |
| Cajuns | 9.2 /100 | #222 | Tragic 6.0% |
| Immigrants from Kenya | 9.2 /100 | #223 | Tragic 6.0% |
| Cubans | 9.2 /100 | #224 | Tragic 6.0% |
| Indonesians | 8.9 /100 | #225 | Tragic 6.0% |
| Immigrants from Singapore | 7.9 /100 | #226 | Tragic 5.9% |
| Immigrants from Western Asia | 7.8 /100 | #227 | Tragic 5.9% |
| Immigrants from Uganda | 7.5 /100 | #228 | Tragic 5.9% |
| Eastern Europeans | 6.8 /100 | #229 | Tragic 5.9% |
| Immigrants from Malaysia | 6.7 /100 | #230 | Tragic 5.9% |
| Immigrants from Switzerland | 6.4 /100 | #231 | Tragic 5.9% |
| Immigrants from Argentina | 6.0 /100 | #232 | Tragic 5.9% |
| Sierra Leoneans | 6.0 /100 | #233 | Tragic 5.9% |
Immigrants from Singapore 4 or more Vehicles in Household Correlation Summary
| Measurement | Immigrants from Singapore Data | 4 or more Vehicles in Household Data |
| Minimum | 0.011% | 0.67% |
| Maximum | 3.7% | 25.7% |
| Range | 3.7% | 25.0% |
| Mean | 0.79% | 7.4% |
| Median | 0.56% | 6.2% |
| Interquartile 25% (IQ1) | 0.28% | 4.7% |
| Interquartile 75% (IQ3) | 0.96% | 8.7% |
| Interquartile Range (IQR) | 0.68% | 4.0% |
| Standard Deviation (Sample) | 0.82% | 4.7% |
| Standard Deviation (Population) | 0.81% | 4.7% |
Correlation Details
| Immigrants from Singapore Percentile | Sample Size | 4 or more Vehicles in Household |
[ 0.0% - 0.5% ] 0.011% | 64,847,425 | 5.8% |
[ 0.0% - 0.5% ] 0.034% | 32,297,951 | 4.8% |
[ 0.0% - 0.5% ] 0.056% | 13,796,509 | 6.9% |
[ 0.0% - 0.5% ] 0.080% | 8,943,716 | 5.6% |
[ 0.0% - 0.5% ] 0.10% | 4,136,219 | 5.7% |
[ 0.0% - 0.5% ] 0.13% | 3,194,729 | 5.5% |
[ 0.0% - 0.5% ] 0.15% | 2,345,374 | 5.6% |
[ 0.0% - 0.5% ] 0.17% | 1,264,126 | 6.7% |
[ 0.0% - 0.5% ] 0.20% | 1,110,581 | 6.4% |
[ 0.0% - 0.5% ] 0.22% | 1,178,213 | 5.1% |
[ 0.0% - 0.5% ] 0.24% | 839,095 | 6.6% |
[ 0.0% - 0.5% ] 0.26% | 644,658 | 6.4% |
[ 0.0% - 0.5% ] 0.29% | 449,062 | 4.7% |
[ 0.0% - 0.5% ] 0.31% | 258,045 | 5.9% |
[ 0.0% - 0.5% ] 0.33% | 189,931 | 8.6% |
[ 0.0% - 0.5% ] 0.35% | 51,876 | 6.8% |
[ 0.0% - 0.5% ] 0.38% | 192,754 | 8.1% |
[ 0.0% - 0.5% ] 0.40% | 87,319 | 6.2% |
[ 0.0% - 0.5% ] 0.42% | 85,662 | 5.8% |
[ 0.0% - 0.5% ] 0.44% | 151,268 | 7.3% |
[ 0.0% - 0.5% ] 0.48% | 68,561 | 8.9% |
[ 0.5% - 1.0% ] 0.50% | 74,105 | 6.9% |
[ 0.5% - 1.0% ] 0.53% | 86,272 | 3.3% |
[ 0.5% - 1.0% ] 0.53% | 17,385 | 18.0% |
[ 0.5% - 1.0% ] 0.56% | 56,113 | 9.0% |
[ 0.5% - 1.0% ] 0.60% | 59,632 | 4.2% |
[ 0.5% - 1.0% ] 0.60% | 25,193 | 5.7% |
[ 0.5% - 1.0% ] 0.63% | 44,965 | 5.4% |
[ 0.5% - 1.0% ] 0.66% | 10,285 | 4.7% |
[ 0.5% - 1.0% ] 0.73% | 6,972 | 2.4% |
[ 0.5% - 1.0% ] 0.75% | 2,136 | 0.67% |
[ 0.5% - 1.0% ] 0.76% | 59,149 | 12.7% |
[ 0.5% - 1.0% ] 0.80% | 16,903 | 2.2% |
[ 0.5% - 1.0% ] 0.84% | 1,894 | 1.6% |
[ 0.5% - 1.0% ] 0.86% | 26,927 | 3.5% |
[ 0.5% - 1.0% ] 0.90% | 22,106 | 12.7% |
[ 0.5% - 1.0% ] 0.95% | 31,185 | 3.7% |
[ 0.5% - 1.0% ] 0.97% | 2,464 | 13.3% |
[ 1.0% - 1.5% ] 1.02% | 10,517 | 8.3% |
[ 1.0% - 1.5% ] 1.07% | 10,534 | 12.1% |
[ 1.0% - 1.5% ] 1.25% | 17,624 | 8.0% |
[ 1.0% - 1.5% ] 1.28% | 1,251 | 11.7% |
[ 1.0% - 1.5% ] 1.43% | 3,571 | 14.8% |
[ 1.0% - 1.5% ] 1.48% | 6,368 | 1.6% |
[ 1.5% - 2.0% ] 1.52% | 395 | 6.0% |
[ 1.5% - 2.0% ] 1.80% | 1,219 | 15.8% |
[ 3.0% - 3.5% ] 3.22% | 3,169 | 0.88% |
[ 3.5% - 4.0% ] 3.63% | 606 | 14.3% |
[ 3.5% - 4.0% ] 3.67% | 817 | 25.7% |