Immigrants from Singapore Disability

COMPARE

Immigrants from Singapore
Race
Ancestry
AfghanAfricanAlaska NativeAlaskan AthabascanAlbanianAleutAlsatianAmericanApacheArabArapahoArgentineanArmenianAssyrian/Chaldean/SyriacAustralianAustrianBahamianBangladeshiBarbadianBasqueBelgianBelizeanBermudanBhutaneseBlackfeetBolivianBrazilianBritishBritish West IndianBulgarianBurmeseCajunCambodianCanadianCape VerdeanCarpatho RusynCelticCentral AmericanCentral American IndianCherokeeCheyenneChickasawChileanChineseChippewaChoctawColombianColvilleComancheCosta RicanCreeCreekCroatianCrowCubanCypriotCzechCzechoslovakianDanishDelawareDominicanDutchDutch West IndianEastern EuropeanEcuadorianEgyptianEnglishEstonianEthiopianEuropeanFijianFilipinoFinnishFrenchFrench American IndianFrench CanadianGermanGerman RussianGhanaianGreekGuamanian/ChamorroGuatemalanGuyaneseHaitianHmongHonduranHopiHoumaHungarianIcelanderIndian (Asian)IndonesianInupiatIranianIraqiIrishIroquoisIsraeliItalianJamaicanJapaneseJordanianKenyanKiowaKoreanLaotianLatvianLebaneseLiberianLithuanianLumbeeLuxembourgerMacedonianMalaysianMalteseMarshalleseMenomineeMexicanMexican American IndianMongolianMoroccanNative HawaiianNavajoNepaleseNew ZealanderNicaraguanNigerianNorthern EuropeanNorwegianOkinawanOsageOttawaPaiutePakistaniPalestinianPanamanianParaguayanPennsylvania GermanPeruvianPimaPolishPortuguesePotawatomiPuebloPuerto RicanPuget Sound SalishRomanianRussianSalvadoranSamoanScandinavianScotch-IrishScottishSeminoleSenegaleseSerbianShoshoneSierra LeoneanSiouxSlavicSlovakSloveneSomaliSouth AfricanSouth AmericanSouth American IndianSoviet UnionSpaniardSpanishSpanish AmericanSpanish American IndianSri LankanSubsaharan AfricanSudaneseSwedishSwissSyrianTaiwaneseThaiTlingit-HaidaTohono O'OdhamTonganTrinidadian and TobagonianTsimshianTurkishU.S. Virgin IslanderUgandanUkrainianUruguayanUteVenezuelanVietnameseWelshWest IndianYakamaYaquiYugoslavianYumanYup'ikZimbabwean
Immigration
NonimmigrantsImmigrantsAfghanistanAfricaAlbaniaArgentinaArmeniaAsiaAustraliaAustriaBahamasBangladeshBarbadosBelarusBelgiumBelizeBoliviaBosnia and HerzegovinaBrazilBulgariaBurma/MyanmarCabo VerdeCambodiaCameroonCanadaCaribbeanCentral AmericaChileChinaColombiaCongoCosta RicaCroatiaCubaCzechoslovakiaDenmarkDominicaDominican RepublicEastern AfricaEastern AsiaEastern EuropeEcuadorEgyptEl SalvadorEnglandEritreaEthiopiaEuropeFijiFranceGermanyGhanaGreeceGrenadaGuatemalaGuyanaHaitiHondurasHong KongHungaryIndiaIndonesiaIranIraqIrelandIsraelItalyJamaicaJapanJordanKazakhstanKenyaKoreaKuwaitLaosLatin AmericaLatviaLebanonLiberiaLithuaniaMalaysiaMexicoMicronesiaMiddle AfricaMoldovaMoroccoNepalNetherlandsNicaraguaNigeriaNorth AmericaNorth MacedoniaNorthern AfricaNorthern EuropeNorwayOceaniaPakistanPanamaPeruPhilippinesPolandPortugalRomaniaRussiaSaudi ArabiaScotlandSenegalSerbiaSierra LeoneSingaporeSomaliaSouth AfricaSouth AmericaSouth Central AsiaSouth Eastern AsiaSouthern EuropeSpainSri LankaSt. Vincent and the GrenadinesSudanSwedenSwitzerlandSyriaTaiwanThailandTrinidad and TobagoTurkeyUgandaUkraineUruguayUzbekistanVenezuelaVietnamWest IndiesWestern AfricaWestern AsiaWestern EuropeYemenZaireZimbabweAzores
Select to Compare
Race
Ancestry
AfghanAfricanAlaska NativeAlaskan AthabascanAlbanianAleutAlsatianAmericanApacheArabArapahoArgentineanArmenianAssyrian/Chaldean/SyriacAustralianAustrianBahamianBangladeshiBarbadianBasqueBelgianBelizeanBermudanBhutaneseBlackfeetBolivianBrazilianBritishBritish West IndianBulgarianBurmeseCajunCambodianCanadianCape VerdeanCarpatho RusynCelticCentral AmericanCentral American IndianCherokeeCheyenneChickasawChileanChineseChippewaChoctawColombianColvilleComancheCosta RicanCreeCreekCroatianCrowCubanCypriotCzechCzechoslovakianDanishDelawareDominicanDutchDutch West IndianEastern EuropeanEcuadorianEgyptianEnglishEstonianEthiopianEuropeanFijianFilipinoFinnishFrenchFrench American IndianFrench CanadianGermanGerman RussianGhanaianGreekGuamanian/ChamorroGuatemalanGuyaneseHaitianHmongHonduranHopiHoumaHungarianIcelanderIndian (Asian)IndonesianInupiatIranianIraqiIrishIroquoisIsraeliItalianJamaicanJapaneseJordanianKenyanKiowaKoreanLaotianLatvianLebaneseLiberianLithuanianLumbeeLuxembourgerMacedonianMalaysianMalteseMarshalleseMenomineeMexicanMexican American IndianMongolianMoroccanNative HawaiianNavajoNepaleseNew ZealanderNicaraguanNigerianNorthern EuropeanNorwegianOkinawanOsageOttawaPaiutePakistaniPalestinianPanamanianParaguayanPennsylvania GermanPeruvianPimaPolishPortuguesePotawatomiPuebloPuerto RicanPuget Sound SalishRomanianRussianSalvadoranSamoanScandinavianScotch-IrishScottishSeminoleSenegaleseSerbianShoshoneSierra LeoneanSiouxSlavicSlovakSloveneSomaliSouth AfricanSouth AmericanSouth American IndianSoviet UnionSpaniardSpanishSpanish AmericanSpanish American IndianSri LankanSubsaharan AfricanSudaneseSwedishSwissSyrianTaiwaneseThaiTlingit-HaidaTohono O'OdhamTonganTrinidadian and TobagonianTsimshianTurkishU.S. Virgin IslanderUgandanUkrainianUruguayanUteVenezuelanVietnameseWelshWest IndianYakamaYaquiYugoslavianYumanYup'ikZimbabwean
Immigration
NonimmigrantsImmigrantsAfghanistanAfricaAlbaniaArgentinaArmeniaAsiaAustraliaAustriaBahamasBangladeshBarbadosBelarusBelgiumBelizeBoliviaBosnia and HerzegovinaBrazilBulgariaBurma/MyanmarCabo VerdeCambodiaCameroonCanadaCaribbeanCentral AmericaChileChinaColombiaCongoCosta RicaCroatiaCubaCzechoslovakiaDenmarkDominicaDominican RepublicEastern AfricaEastern AsiaEastern EuropeEcuadorEgyptEl SalvadorEnglandEritreaEthiopiaEuropeFijiFranceGermanyGhanaGreeceGrenadaGuatemalaGuyanaHaitiHondurasHong KongHungaryIndiaIndonesiaIranIraqIrelandIsraelItalyJamaicaJapanJordanKazakhstanKenyaKoreaKuwaitLaosLatin AmericaLatviaLebanonLiberiaLithuaniaMalaysiaMexicoMicronesiaMiddle AfricaMoldovaMoroccoNepalNetherlandsNicaraguaNigeriaNorth AmericaNorth MacedoniaNorthern AfricaNorthern EuropeNorwayOceaniaPakistanPanamaPeruPhilippinesPolandPortugalRomaniaRussiaSaudi ArabiaScotlandSenegalSerbiaSierra LeoneSomaliaSouth AfricaSouth AmericaSouth Central AsiaSouth Eastern AsiaSouthern EuropeSpainSri LankaSt. Vincent and the GrenadinesSudanSwedenSwitzerlandSyriaTaiwanThailandTrinidad and TobagoTurkeyUgandaUkraineUruguayUzbekistanVenezuelaVietnamWest IndiesWestern AfricaWestern AsiaWestern EuropeYemenZaireZimbabweAzores
Disability
Income
Poverty
Unemployment
Labor Participation
Family Structure
Vehicle Availability
Education Level
Disability

Immigrants from Singapore Disability
Exceptional

10.0%
DISABILITY
100.0/ 100
METRIC RATING
7th/ 347
METRIC RANK

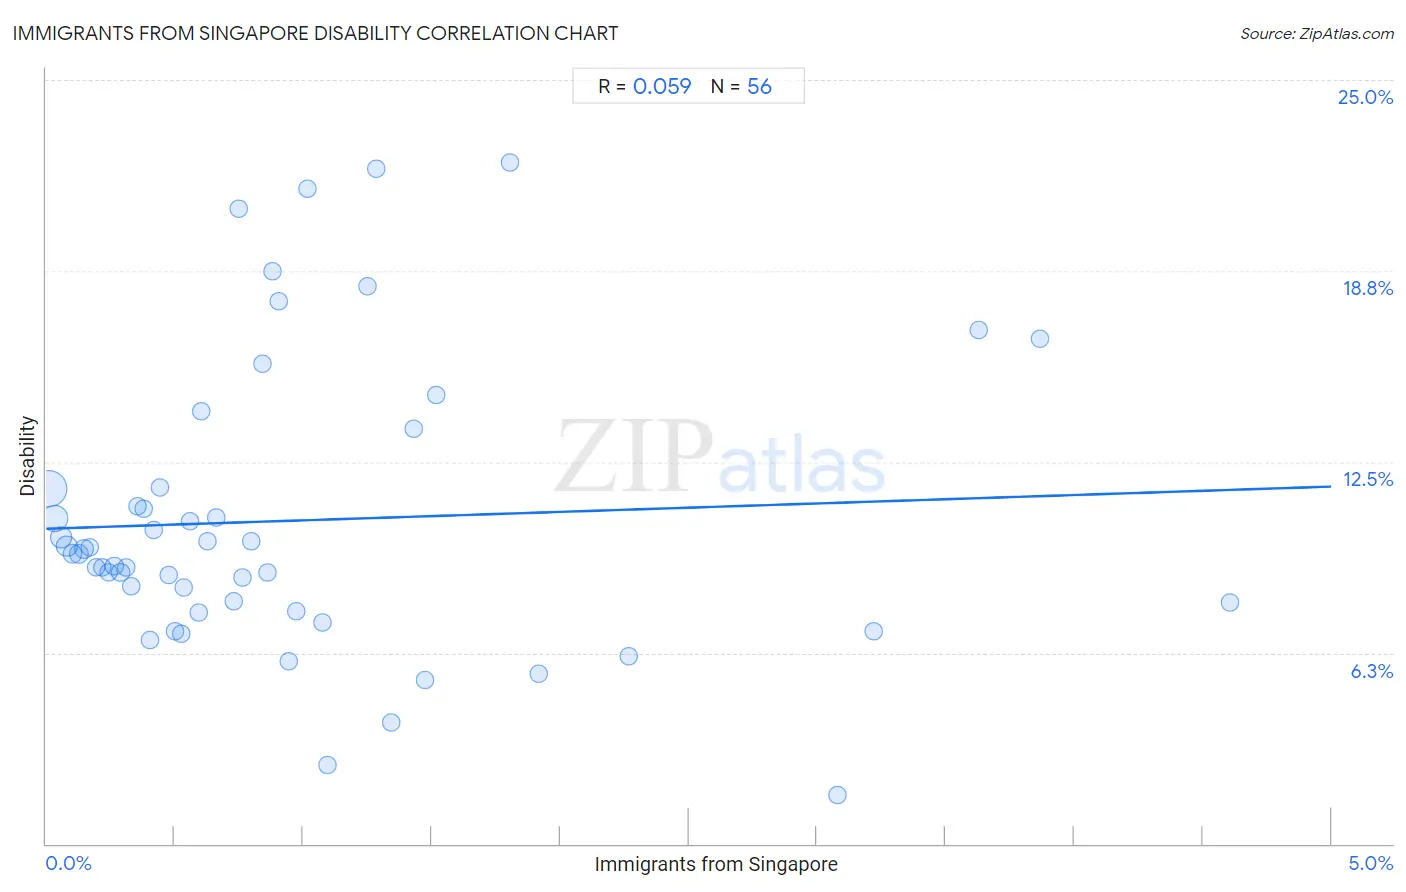
Immigrants from Singapore Disability Correlation Chart

The statistical analysis conducted on geographies consisting of 137,520,897 people shows a slight positive correlation between the proportion of Immigrants from Singapore and percentage of population with a disability in the United States with a correlation coefficient (R) of 0.059 and weighted average of 10.0%. On average, for every 1% (one percent) increase in Immigrants from Singapore within a typical geography, there is an increase of 0.28% in percentage of population with a disability.
Immigrants from Singapore Disability
It is essential to understand that the correlation between the percentage of Immigrants from Singapore and percentage of population with a disability does not imply a direct cause-and-effect relationship. It remains uncertain whether the presence of Immigrants from Singapore influences an upward or downward trend in the level of percentage of population with a disability within an area, or if Immigrants from Singapore simply ended up residing in those areas with higher or lower levels of percentage of population with a disability due to other factors.

Demographics Similar to Immigrants from Singapore by Disability

In terms of disability, the demographic groups most similar to Immigrants from Singapore are Bolivian (10.0%, a difference of 0.23%), Immigrants from South Central Asia (9.9%, a difference of 0.31%), Immigrants from Hong Kong (10.0%, a difference of 0.52%), Immigrants from Bolivia (9.9%, a difference of 1.2%), and Immigrants from China (10.1%, a difference of 1.3%).
DemographicsRating | RankDisability
Immigrants from India
100.0
/100
|
#1
Exceptional
9.5%
Filipinos
100.0
/100
|
#2
Exceptional
9.6%
Immigrants from Taiwan
100.0
/100
|
#3
Exceptional
9.6%
Thais
100.0
/100
|
#4
Exceptional
9.7%
Immigrants from Bolivia
100.0
/100
|
#5
Exceptional
9.9%
Immigrants from South Central Asia
100.0
/100
|
#6
Exceptional
9.9%
Immigrants from Singapore
100.0
/100
|
#7
Exceptional
10.0%
Bolivians
100.0
/100
|
#8
Exceptional
10.0%
Immigrants from Hong Kong
100.0
/100
|
#9
Exceptional
10.0%
Immigrants from China
100.0
/100
|
#10
Exceptional
10.1%
Iranians
100.0
/100
|
#11
Exceptional
10.1%
Immigrants from Israel
100.0
/100
|
#12
Exceptional
10.1%
Immigrants from Eastern Asia
100.0
/100
|
#13
Exceptional
10.2%
Immigrants from Korea
100.0
/100
|
#14
Exceptional
10.2%
Okinawans
100.0
/100
|
#15
Exceptional
10.3%

Immigrants from Singapore Disability Correlation Summary

MeasurementImmigrants from Singapore DataDisability Data
Minimum0.011%1.6%
Maximum4.6%22.3%
Range4.6%20.7%
Mean0.96%10.6%
Median0.65%9.5%
Interquartile 25% (IQ1)0.32%7.7%
Interquartile 75% (IQ3)1.2%11.6%
Interquartile Range (IQR)0.85%3.9%
Standard Deviation (Sample)1.0%4.7%
Standard Deviation (Population)1.00%4.7%

Correlation Details

Immigrants from Singapore PercentileSample SizeDisability
[
0.0%
-
0.5%
]
0.011%
65,010,26911.6%
[
0.0%
-
0.5%
]
0.033%
32,543,96910.7%
[
0.0%
-
0.5%
]
0.056%
13,827,36810.0%
[
0.0%
-
0.5%
]
0.080%
8,978,2949.7%
[
0.0%
-
0.5%
]
0.10%
4,213,4949.5%
[
0.0%
-
0.5%
]
0.13%
3,197,6899.5%
[
0.0%
-
0.5%
]
0.15%
2,378,0199.6%
[
0.0%
-
0.5%
]
0.17%
1,271,5229.7%
[
0.0%
-
0.5%
]
0.20%
1,191,5849.0%
[
0.0%
-
0.5%
]
0.22%
1,188,2089.1%
[
0.0%
-
0.5%
]
0.24%
839,0958.9%
[
0.0%
-
0.5%
]
0.26%
648,1919.1%
[
0.0%
-
0.5%
]
0.29%
449,0628.9%
[
0.0%
-
0.5%
]
0.31%
258,0459.1%
[
0.0%
-
0.5%
]
0.33%
214,4538.4%
[
0.0%
-
0.5%
]
0.35%
51,87611.0%
[
0.0%
-
0.5%
]
0.38%
192,75411.0%
[
0.0%
-
0.5%
]
0.40%
87,3196.7%
[
0.0%
-
0.5%
]
0.42%
90,47110.3%
[
0.0%
-
0.5%
]
0.44%
154,00911.7%
[
0.0%
-
0.5%
]
0.48%
73,1548.8%
[
0.5%
-
1.0%
]
0.50%
74,1057.0%
[
0.5%
-
1.0%
]
0.53%
86,2726.9%
[
0.5%
-
1.0%
]
0.54%
18,8668.4%
[
0.5%
-
1.0%
]
0.56%
56,29310.5%
[
0.5%
-
1.0%
]
0.60%
59,6327.6%
[
0.5%
-
1.0%
]
0.60%
31,97814.1%
[
0.5%
-
1.0%
]
0.63%
44,9659.9%
[
0.5%
-
1.0%
]
0.66%
12,08810.7%
[
0.5%
-
1.0%
]
0.73%
9,7157.9%
[
0.5%
-
1.0%
]
0.75%
2,13620.8%
[
0.5%
-
1.0%
]
0.77%
69,3858.7%
[
0.5%
-
1.0%
]
0.80%
16,9039.9%
[
0.5%
-
1.0%
]
0.84%
3,67615.7%
[
0.5%
-
1.0%
]
0.86%
26,9278.9%
[
0.5%
-
1.0%
]
0.88%
12,03918.7%
[
0.5%
-
1.0%
]
0.90%
22,10617.8%
[
0.5%
-
1.0%
]
0.95%
31,1856.0%
[
0.5%
-
1.0%
]
0.97%
2,4647.6%
[
1.0%
-
1.5%
]
1.02%
10,51721.4%
[
1.0%
-
1.5%
]
1.07%
10,5347.2%
[
1.0%
-
1.5%
]
1.09%
11,9892.6%
[
1.0%
-
1.5%
]
1.25%
17,62418.3%
[
1.0%
-
1.5%
]
1.28%
3,89322.1%
[
1.0%
-
1.5%
]
1.34%
4,4744.0%
[
1.0%
-
1.5%
]
1.43%
3,57113.6%
[
1.0%
-
1.5%
]
1.48%
6,3685.4%
[
1.5%
-
2.0%
]
1.52%
39514.7%
[
1.5%
-
2.0%
]
1.80%
1,21922.3%
[
1.5%
-
2.0%
]
1.91%
2,0895.6%
[
2.0%
-
2.5%
]
2.27%
3096.1%
[
3.0%
-
3.5%
]
3.08%
3,7361.6%
[
3.0%
-
3.5%
]
3.22%
3,1697.0%
[
3.5%
-
4.0%
]
3.63%
60616.8%
[
3.5%
-
4.0%
]
3.87%
67216.5%
[
4.5%
-
5.0%
]
4.61%
1527.9%