Immigrants from Senegal Married-Couple Family Poverty

COMPARE

Immigrants from Senegal
Race
Ancestry
AfghanAfricanAlaska NativeAlaskan AthabascanAlbanianAleutAlsatianAmericanApacheArabArapahoArgentineanArmenianAssyrian/Chaldean/SyriacAustralianAustrianBahamianBangladeshiBarbadianBasqueBelgianBelizeanBermudanBhutaneseBlackfeetBolivianBrazilianBritishBritish West IndianBulgarianBurmeseCajunCambodianCanadianCape VerdeanCarpatho RusynCelticCentral AmericanCentral American IndianCherokeeCheyenneChickasawChileanChineseChippewaChoctawColombianColvilleComancheCosta RicanCreeCreekCroatianCrowCubanCypriotCzechCzechoslovakianDanishDelawareDominicanDutchDutch West IndianEastern EuropeanEcuadorianEgyptianEnglishEstonianEthiopianEuropeanFijianFilipinoFinnishFrenchFrench American IndianFrench CanadianGermanGerman RussianGhanaianGreekGuamanian/ChamorroGuatemalanGuyaneseHaitianHmongHonduranHopiHoumaHungarianIcelanderIndian (Asian)IndonesianInupiatIranianIraqiIrishIroquoisIsraeliItalianJamaicanJapaneseJordanianKenyanKiowaKoreanLaotianLatvianLebaneseLiberianLithuanianLumbeeLuxembourgerMacedonianMalaysianMalteseMarshalleseMenomineeMexicanMexican American IndianMongolianMoroccanNative HawaiianNavajoNepaleseNew ZealanderNicaraguanNigerianNorthern EuropeanNorwegianOkinawanOsageOttawaPaiutePakistaniPalestinianPanamanianParaguayanPennsylvania GermanPeruvianPimaPolishPortuguesePotawatomiPuebloPuerto RicanPuget Sound SalishRomanianRussianSalvadoranSamoanScandinavianScotch-IrishScottishSeminoleSenegaleseSerbianShoshoneSierra LeoneanSiouxSlavicSlovakSloveneSomaliSouth AfricanSouth AmericanSouth American IndianSoviet UnionSpaniardSpanishSpanish AmericanSpanish American IndianSri LankanSubsaharan AfricanSudaneseSwedishSwissSyrianTaiwaneseThaiTlingit-HaidaTohono O'OdhamTonganTrinidadian and TobagonianTsimshianTurkishU.S. Virgin IslanderUgandanUkrainianUruguayanUteVenezuelanVietnameseWelshWest IndianYakamaYaquiYugoslavianYumanYup'ikZimbabwean
Immigration
NonimmigrantsImmigrantsAfghanistanAfricaAlbaniaArgentinaArmeniaAsiaAustraliaAustriaBahamasBangladeshBarbadosBelarusBelgiumBelizeBoliviaBosnia and HerzegovinaBrazilBulgariaBurma/MyanmarCabo VerdeCambodiaCameroonCanadaCaribbeanCentral AmericaChileChinaColombiaCongoCosta RicaCroatiaCubaCzechoslovakiaDenmarkDominicaDominican RepublicEastern AfricaEastern AsiaEastern EuropeEcuadorEgyptEl SalvadorEnglandEritreaEthiopiaEuropeFijiFranceGermanyGhanaGreeceGrenadaGuatemalaGuyanaHaitiHondurasHong KongHungaryIndiaIndonesiaIranIraqIrelandIsraelItalyJamaicaJapanJordanKazakhstanKenyaKoreaKuwaitLaosLatin AmericaLatviaLebanonLiberiaLithuaniaMalaysiaMexicoMicronesiaMiddle AfricaMoldovaMoroccoNepalNetherlandsNicaraguaNigeriaNorth AmericaNorth MacedoniaNorthern AfricaNorthern EuropeNorwayOceaniaPakistanPanamaPeruPhilippinesPolandPortugalRomaniaRussiaSaudi ArabiaScotlandSenegalSerbiaSierra LeoneSingaporeSomaliaSouth AfricaSouth AmericaSouth Central AsiaSouth Eastern AsiaSouthern EuropeSpainSri LankaSt. Vincent and the GrenadinesSudanSwedenSwitzerlandSyriaTaiwanThailandTrinidad and TobagoTurkeyUgandaUkraineUruguayUzbekistanVenezuelaVietnamWest IndiesWestern AfricaWestern AsiaWestern EuropeYemenZaireZimbabweAzores
Select to Compare
Race
Ancestry
AfghanAfricanAlaska NativeAlaskan AthabascanAlbanianAleutAlsatianAmericanApacheArabArapahoArgentineanArmenianAssyrian/Chaldean/SyriacAustralianAustrianBahamianBangladeshiBarbadianBasqueBelgianBelizeanBermudanBhutaneseBlackfeetBolivianBrazilianBritishBritish West IndianBulgarianBurmeseCajunCambodianCanadianCape VerdeanCarpatho RusynCelticCentral AmericanCentral American IndianCherokeeCheyenneChickasawChileanChineseChippewaChoctawColombianColvilleComancheCosta RicanCreeCreekCroatianCrowCubanCypriotCzechCzechoslovakianDanishDelawareDominicanDutchDutch West IndianEastern EuropeanEcuadorianEgyptianEnglishEstonianEthiopianEuropeanFijianFilipinoFinnishFrenchFrench American IndianFrench CanadianGermanGerman RussianGhanaianGreekGuamanian/ChamorroGuatemalanGuyaneseHaitianHmongHonduranHopiHoumaHungarianIcelanderIndian (Asian)IndonesianInupiatIranianIraqiIrishIroquoisIsraeliItalianJamaicanJapaneseJordanianKenyanKiowaKoreanLaotianLatvianLebaneseLiberianLithuanianLumbeeLuxembourgerMacedonianMalaysianMalteseMarshalleseMenomineeMexicanMexican American IndianMongolianMoroccanNative HawaiianNavajoNepaleseNew ZealanderNicaraguanNigerianNorthern EuropeanNorwegianOkinawanOsageOttawaPaiutePakistaniPalestinianPanamanianParaguayanPennsylvania GermanPeruvianPimaPolishPortuguesePotawatomiPuebloPuerto RicanPuget Sound SalishRomanianRussianSalvadoranSamoanScandinavianScotch-IrishScottishSeminoleSenegaleseSerbianShoshoneSierra LeoneanSiouxSlavicSlovakSloveneSomaliSouth AfricanSouth AmericanSouth American IndianSoviet UnionSpaniardSpanishSpanish AmericanSpanish American IndianSri LankanSubsaharan AfricanSudaneseSwedishSwissSyrianTaiwaneseThaiTlingit-HaidaTohono O'OdhamTonganTrinidadian and TobagonianTsimshianTurkishU.S. Virgin IslanderUgandanUkrainianUruguayanUteVenezuelanVietnameseWelshWest IndianYakamaYaquiYugoslavianYumanYup'ikZimbabwean
Immigration
NonimmigrantsImmigrantsAfghanistanAfricaAlbaniaArgentinaArmeniaAsiaAustraliaAustriaBahamasBangladeshBarbadosBelarusBelgiumBelizeBoliviaBosnia and HerzegovinaBrazilBulgariaBurma/MyanmarCabo VerdeCambodiaCameroonCanadaCaribbeanCentral AmericaChileChinaColombiaCongoCosta RicaCroatiaCubaCzechoslovakiaDenmarkDominicaDominican RepublicEastern AfricaEastern AsiaEastern EuropeEcuadorEgyptEl SalvadorEnglandEritreaEthiopiaEuropeFijiFranceGermanyGhanaGreeceGrenadaGuatemalaGuyanaHaitiHondurasHong KongHungaryIndiaIndonesiaIranIraqIrelandIsraelItalyJamaicaJapanJordanKazakhstanKenyaKoreaKuwaitLaosLatin AmericaLatviaLebanonLiberiaLithuaniaMalaysiaMexicoMicronesiaMiddle AfricaMoldovaMoroccoNepalNetherlandsNicaraguaNigeriaNorth AmericaNorth MacedoniaNorthern AfricaNorthern EuropeNorwayOceaniaPakistanPanamaPeruPhilippinesPolandPortugalRomaniaRussiaSaudi ArabiaScotlandSerbiaSierra LeoneSingaporeSomaliaSouth AfricaSouth AmericaSouth Central AsiaSouth Eastern AsiaSouthern EuropeSpainSri LankaSt. Vincent and the GrenadinesSudanSwedenSwitzerlandSyriaTaiwanThailandTrinidad and TobagoTurkeyUgandaUkraineUruguayUzbekistanVenezuelaVietnamWest IndiesWestern AfricaWestern AsiaWestern EuropeYemenZaireZimbabweAzores
Married-Couple Family Poverty
Income
Poverty
Unemployment
Labor Participation
Family Structure
Vehicle Availability
Education Level
Disability

Immigrants from Senegal Married-Couple Family Poverty
Tragic

6.1%
POVERTY | MARRIED-COUPLE FAMILIES
0.3/ 100
METRIC RATING
263rd/ 347
METRIC RANK

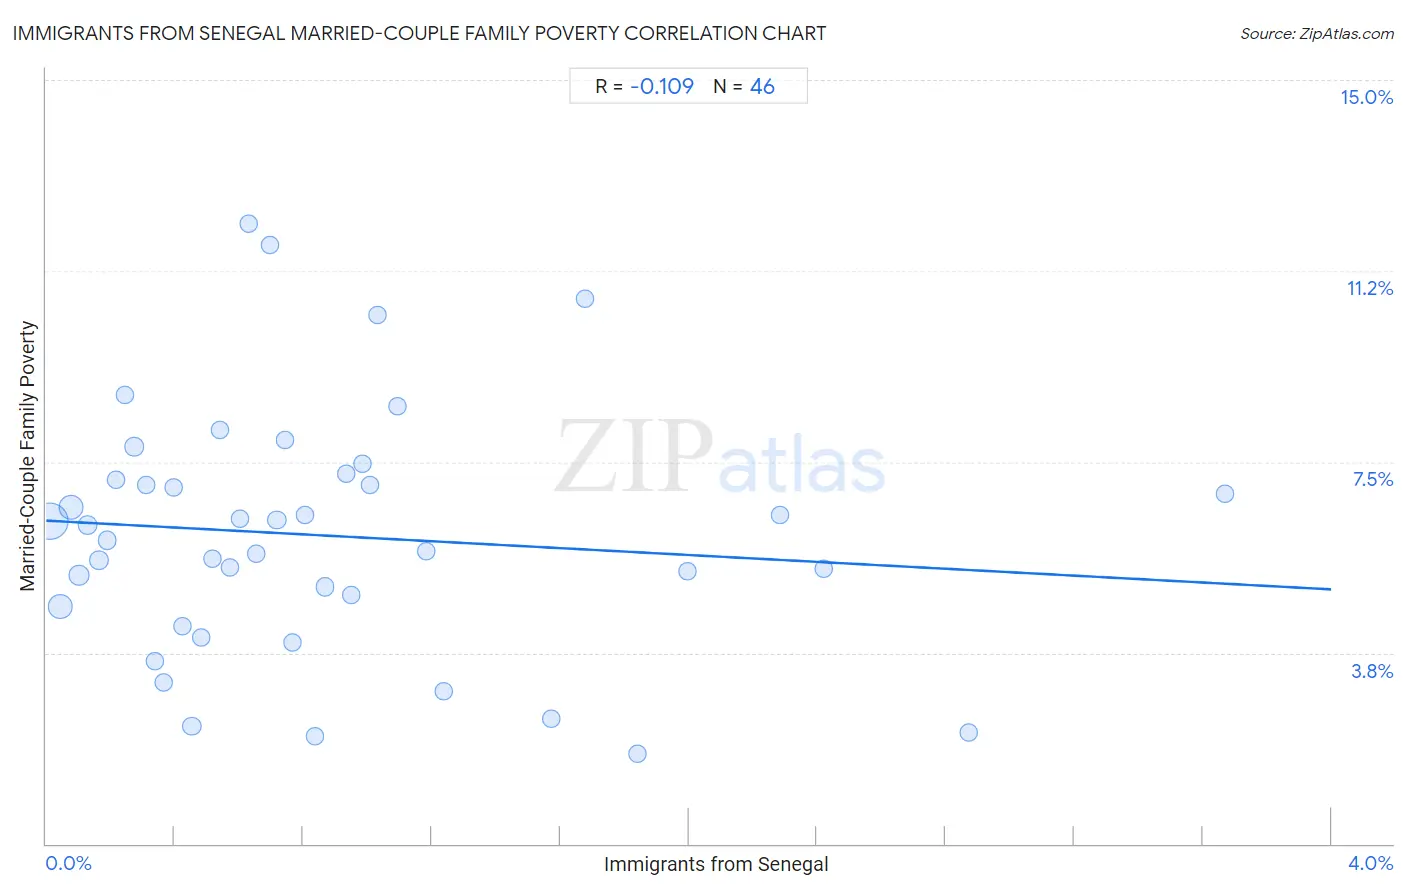
Immigrants from Senegal Married-Couple Family Poverty Correlation Chart

The statistical analysis conducted on geographies consisting of 89,915,851 people shows a poor negative correlation between the proportion of Immigrants from Senegal and poverty level among married-couple families in the United States with a correlation coefficient (R) of -0.109 and weighted average of 6.1%. On average, for every 1% (one percent) increase in Immigrants from Senegal within a typical geography, there is a decrease of 0.34% in poverty level among married-couple families.
Immigrants from Senegal Married-Couple Family Poverty
It is essential to understand that the correlation between the percentage of Immigrants from Senegal and poverty level among married-couple families does not imply a direct cause-and-effect relationship. It remains uncertain whether the presence of Immigrants from Senegal influences an upward or downward trend in the level of poverty level among married-couple families within an area, or if Immigrants from Senegal simply ended up residing in those areas with higher or lower levels of poverty level among married-couple families due to other factors.

Demographics Similar to Immigrants from Senegal by Married-Couple Family Poverty

In terms of married-couple family poverty, the demographic groups most similar to Immigrants from Senegal are Immigrants from Congo (6.1%, a difference of 0.22%), Shoshone (6.1%, a difference of 0.39%), Senegalese (6.1%, a difference of 0.60%), Blackfeet (6.2%, a difference of 0.66%), and Creek (6.2%, a difference of 0.73%).
DemographicsRating | RankMarried-Couple Family Poverty
Bangladeshis
0.5
/100
|
#256
Tragic
6.0%
Immigrants from Burma/Myanmar
0.5
/100
|
#257
Tragic
6.0%
Immigrants
0.5
/100
|
#258
Tragic
6.0%
Alaskan Athabascans
0.4
/100
|
#259
Tragic
6.1%
Jamaicans
0.3
/100
|
#260
Tragic
6.1%
Senegalese
0.3
/100
|
#261
Tragic
6.1%
Shoshone
0.3
/100
|
#262
Tragic
6.1%
Immigrants from Senegal
0.3
/100
|
#263
Tragic
6.1%
Immigrants from Congo
0.2
/100
|
#264
Tragic
6.1%
Blackfeet
0.2
/100
|
#265
Tragic
6.2%
Creek
0.2
/100
|
#266
Tragic
6.2%
Spanish Americans
0.2
/100
|
#267
Tragic
6.2%
Alaska Natives
0.2
/100
|
#268
Tragic
6.2%
Immigrants from West Indies
0.1
/100
|
#269
Tragic
6.2%
Immigrants from Jamaica
0.1
/100
|
#270
Tragic
6.2%

Immigrants from Senegal Married-Couple Family Poverty Correlation Summary

MeasurementImmigrants from Senegal DataMarried-Couple Family Poverty Data
Minimum0.0099%1.8%
Maximum3.7%12.2%
Range3.7%10.4%
Mean0.87%6.1%
Median0.68%6.1%
Interquartile 25% (IQ1)0.34%4.7%
Interquartile 75% (IQ3)1.0%7.1%
Interquartile Range (IQR)0.69%2.5%
Standard Deviation (Sample)0.78%2.4%
Standard Deviation (Population)0.77%2.4%

Correlation Details

Immigrants from Senegal PercentileSample SizeMarried-Couple Family Poverty
[
0.0%
-
0.5%
]
0.0099%
44,150,9636.3%
[
0.0%
-
0.5%
]
0.045%
13,480,4404.7%
[
0.0%
-
0.5%
]
0.076%
15,767,5366.6%
[
0.0%
-
0.5%
]
0.10%
4,720,9795.3%
[
0.0%
-
0.5%
]
0.13%
2,615,8536.3%
[
0.0%
-
0.5%
]
0.16%
1,918,6035.6%
[
0.0%
-
0.5%
]
0.19%
1,433,0146.0%
[
0.0%
-
0.5%
]
0.22%
983,1297.1%
[
0.0%
-
0.5%
]
0.25%
361,2748.8%
[
0.0%
-
0.5%
]
0.27%
733,8237.8%
[
0.0%
-
0.5%
]
0.31%
249,3957.1%
[
0.0%
-
0.5%
]
0.34%
372,4413.6%
[
0.0%
-
0.5%
]
0.37%
288,4993.2%
[
0.0%
-
0.5%
]
0.40%
379,7017.0%
[
0.0%
-
0.5%
]
0.43%
189,9884.3%
[
0.0%
-
0.5%
]
0.45%
168,7832.3%
[
0.0%
-
0.5%
]
0.48%
143,4434.1%
[
0.5%
-
1.0%
]
0.52%
163,3995.6%
[
0.5%
-
1.0%
]
0.54%
252,6318.1%
[
0.5%
-
1.0%
]
0.57%
198,6955.4%
[
0.5%
-
1.0%
]
0.60%
124,2696.4%
[
0.5%
-
1.0%
]
0.63%
262,16312.2%
[
0.5%
-
1.0%
]
0.65%
118,3975.7%
[
0.5%
-
1.0%
]
0.70%
32,50411.8%
[
0.5%
-
1.0%
]
0.72%
154,2376.4%
[
0.5%
-
1.0%
]
0.74%
90,6237.9%
[
0.5%
-
1.0%
]
0.77%
36,4484.0%
[
0.5%
-
1.0%
]
0.80%
123,2546.4%
[
0.5%
-
1.0%
]
0.84%
10,5272.1%
[
0.5%
-
1.0%
]
0.87%
80,1595.0%
[
0.5%
-
1.0%
]
0.93%
5,8847.3%
[
0.5%
-
1.0%
]
0.95%
63,1044.9%
[
0.5%
-
1.0%
]
0.98%
18,0917.5%
[
1.0%
-
1.5%
]
1.01%
63,9387.1%
[
1.0%
-
1.5%
]
1.03%
16,07110.4%
[
1.0%
-
1.5%
]
1.09%
21,9378.6%
[
1.0%
-
1.5%
]
1.18%
20,9035.8%
[
1.0%
-
1.5%
]
1.24%
38,2353.0%
[
1.5%
-
2.0%
]
1.57%
19,0692.5%
[
1.5%
-
2.0%
]
1.68%
3,57510.7%
[
1.5%
-
2.0%
]
1.84%
8,2551.8%
[
1.5%
-
2.0%
]
2.00%
13,3235.3%
[
2.0%
-
2.5%
]
2.28%
8766.5%
[
2.0%
-
2.5%
]
2.42%
10,9915.4%
[
2.5%
-
3.0%
]
2.87%
4,4932.2%
[
3.5%
-
4.0%
]
3.67%
1,9366.9%