Immigrants from Senegal No Vehicles in Household
COMPARE
Immigrants from Senegal
Select to Compare
No Vehicles in Household
Immigrants from Senegal No Vehicles in Household
21.1%
NO VEHICLES AVAILABLE
0.0/ 100
METRIC RATING
327th/ 347
METRIC RANK
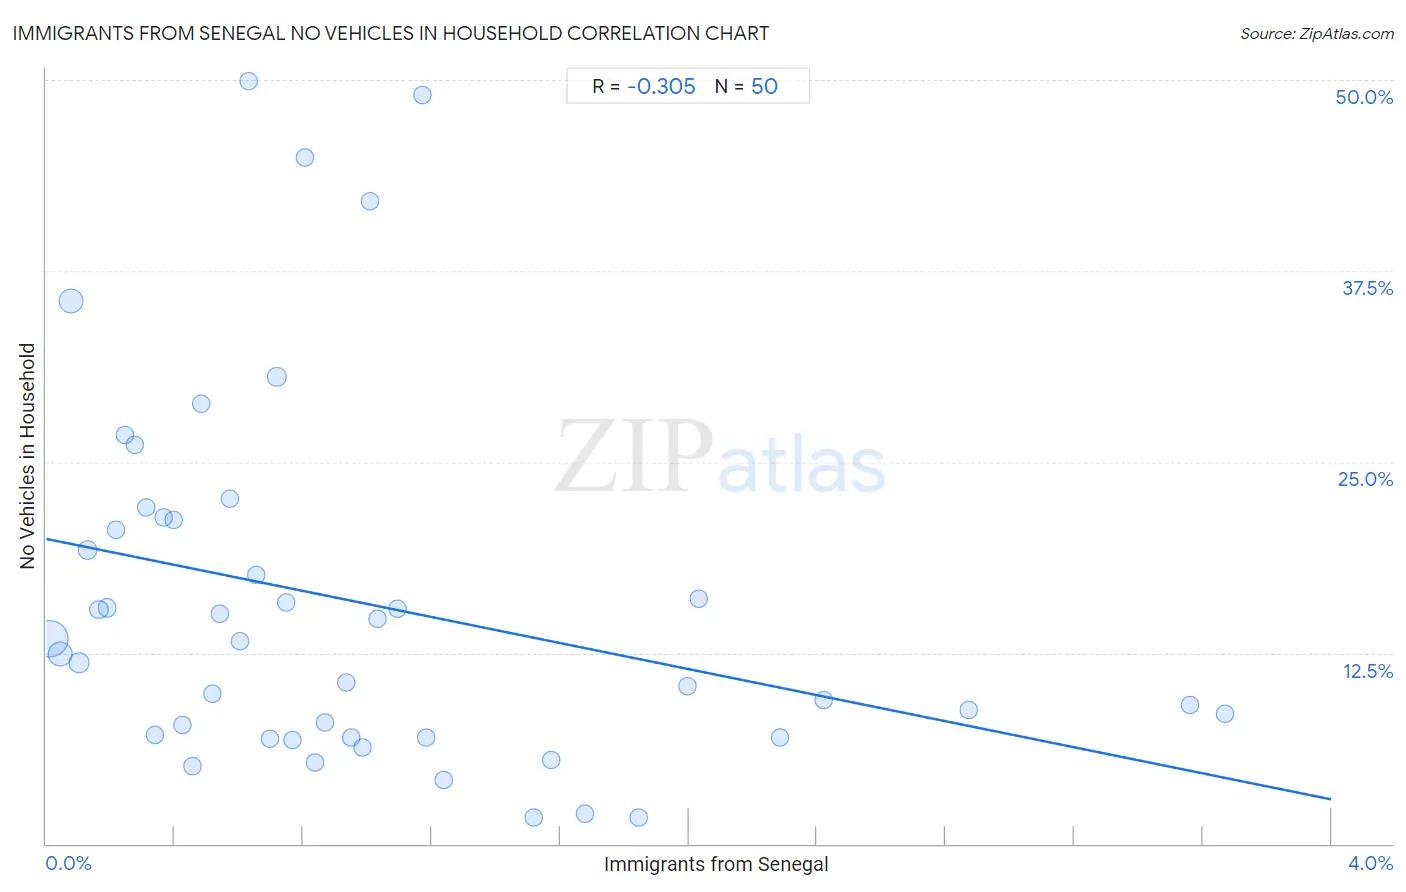
Immigrants from Senegal No Vehicles in Household Correlation Chart
The statistical analysis conducted on geographies consisting of 90,082,308 people shows a mild negative correlation between the proportion of Immigrants from Senegal and percentage of households with no vehicle available in the United States with a correlation coefficient (R) of -0.305 and weighted average of 21.1%. On average, for every 1% (one percent) increase in Immigrants from Senegal within a typical geography, there is a decrease of 4.3% in percentage of households with no vehicle available.
It is essential to understand that the correlation between the percentage of Immigrants from Senegal and percentage of households with no vehicle available does not imply a direct cause-and-effect relationship. It remains uncertain whether the presence of Immigrants from Senegal influences an upward or downward trend in the level of percentage of households with no vehicle available within an area, or if Immigrants from Senegal simply ended up residing in those areas with higher or lower levels of percentage of households with no vehicle available due to other factors.
Demographics Similar to Immigrants from Senegal by No Vehicles in Household
In terms of no vehicles in household, the demographic groups most similar to Immigrants from Senegal are Immigrants from West Indies (20.5%, a difference of 3.0%), Immigrants from Dominica (22.2%, a difference of 5.1%), Senegalese (19.8%, a difference of 7.0%), Ecuadorian (22.8%, a difference of 7.6%), and Immigrants from Caribbean (19.6%, a difference of 7.8%).
| Demographics | Rating | Rank | No Vehicles in Household |
| Soviet Union | 0.0 /100 | #320 | Tragic 17.4% |
| Jamaicans | 0.0 /100 | #321 | Tragic 17.9% |
| Immigrants from Cabo Verde | 0.0 /100 | #322 | Tragic 18.4% |
| Immigrants from Yemen | 0.0 /100 | #323 | Tragic 19.5% |
| Immigrants from Caribbean | 0.0 /100 | #324 | Tragic 19.6% |
| Senegalese | 0.0 /100 | #325 | Tragic 19.8% |
| Immigrants from West Indies | 0.0 /100 | #326 | Tragic 20.5% |
| Immigrants from Senegal | 0.0 /100 | #327 | Tragic 21.1% |
| Immigrants from Dominica | 0.0 /100 | #328 | Tragic 22.2% |
| Ecuadorians | 0.0 /100 | #329 | Tragic 22.8% |
| West Indians | 0.0 /100 | #330 | Tragic 23.7% |
| Trinidadians and Tobagonians | 0.0 /100 | #331 | Tragic 23.7% |
| Immigrants from Ecuador | 0.0 /100 | #332 | Tragic 23.8% |
| Immigrants from Trinidad and Tobago | 0.0 /100 | #333 | Tragic 24.6% |
| Immigrants from Bangladesh | 0.0 /100 | #334 | Tragic 25.8% |
Immigrants from Senegal No Vehicles in Household Correlation Summary
| Measurement | Immigrants from Senegal Data | No Vehicles in Household Data |
| Minimum | 0.0099% | 1.7% |
| Maximum | 3.7% | 49.9% |
| Range | 3.7% | 48.2% |
| Mean | 0.96% | 15.8% |
| Median | 0.73% | 12.8% |
| Interquartile 25% (IQ1) | 0.37% | 7.0% |
| Interquartile 75% (IQ3) | 1.2% | 21.2% |
| Interquartile Range (IQR) | 0.82% | 14.2% |
| Standard Deviation (Sample) | 0.86% | 12.0% |
| Standard Deviation (Population) | 0.85% | 11.9% |
Correlation Details
| Immigrants from Senegal Percentile | Sample Size | No Vehicles in Household |
[ 0.0% - 0.5% ] 0.0099% | 44,150,963 | 13.4% |
[ 0.0% - 0.5% ] 0.045% | 13,480,440 | 12.4% |
[ 0.0% - 0.5% ] 0.076% | 15,770,170 | 35.5% |
[ 0.0% - 0.5% ] 0.10% | 4,728,696 | 11.8% |
[ 0.0% - 0.5% ] 0.13% | 2,642,539 | 19.2% |
[ 0.0% - 0.5% ] 0.16% | 1,918,603 | 15.3% |
[ 0.0% - 0.5% ] 0.19% | 1,441,706 | 15.4% |
[ 0.0% - 0.5% ] 0.22% | 983,129 | 20.5% |
[ 0.0% - 0.5% ] 0.25% | 357,790 | 26.8% |
[ 0.0% - 0.5% ] 0.27% | 761,521 | 26.1% |
[ 0.0% - 0.5% ] 0.31% | 255,890 | 22.0% |
[ 0.0% - 0.5% ] 0.34% | 385,814 | 7.1% |
[ 0.0% - 0.5% ] 0.37% | 285,657 | 21.4% |
[ 0.0% - 0.5% ] 0.40% | 379,701 | 21.2% |
[ 0.0% - 0.5% ] 0.43% | 189,988 | 7.7% |
[ 0.0% - 0.5% ] 0.45% | 174,041 | 5.1% |
[ 0.0% - 0.5% ] 0.48% | 143,443 | 28.8% |
[ 0.5% - 1.0% ] 0.52% | 163,399 | 9.8% |
[ 0.5% - 1.0% ] 0.54% | 262,277 | 15.1% |
[ 0.5% - 1.0% ] 0.57% | 198,695 | 22.6% |
[ 0.5% - 1.0% ] 0.60% | 124,269 | 13.2% |
[ 0.5% - 1.0% ] 0.63% | 262,163 | 49.9% |
[ 0.5% - 1.0% ] 0.65% | 118,397 | 17.6% |
[ 0.5% - 1.0% ] 0.70% | 32,504 | 6.9% |
[ 0.5% - 1.0% ] 0.72% | 154,237 | 30.6% |
[ 0.5% - 1.0% ] 0.75% | 94,692 | 15.8% |
[ 0.5% - 1.0% ] 0.77% | 36,448 | 6.8% |
[ 0.5% - 1.0% ] 0.80% | 124,504 | 44.9% |
[ 0.5% - 1.0% ] 0.84% | 10,527 | 5.3% |
[ 0.5% - 1.0% ] 0.87% | 80,159 | 7.9% |
[ 0.5% - 1.0% ] 0.93% | 5,884 | 10.5% |
[ 0.5% - 1.0% ] 0.95% | 63,104 | 7.0% |
[ 0.5% - 1.0% ] 0.98% | 18,091 | 6.3% |
[ 1.0% - 1.5% ] 1.01% | 63,938 | 42.1% |
[ 1.0% - 1.5% ] 1.03% | 16,071 | 14.8% |
[ 1.0% - 1.5% ] 1.09% | 21,937 | 15.4% |
[ 1.0% - 1.5% ] 1.17% | 53,012 | 49.0% |
[ 1.0% - 1.5% ] 1.18% | 20,903 | 6.9% |
[ 1.0% - 1.5% ] 1.24% | 38,235 | 4.2% |
[ 1.5% - 2.0% ] 1.52% | 4,024 | 1.7% |
[ 1.5% - 2.0% ] 1.57% | 19,069 | 5.5% |
[ 1.5% - 2.0% ] 1.68% | 3,575 | 2.0% |
[ 1.5% - 2.0% ] 1.84% | 3,365 | 1.7% |
[ 1.5% - 2.0% ] 2.00% | 13,323 | 10.3% |
[ 2.0% - 2.5% ] 2.03% | 3,497 | 16.0% |
[ 2.0% - 2.5% ] 2.28% | 876 | 7.0% |
[ 2.0% - 2.5% ] 2.42% | 10,991 | 9.4% |
[ 2.5% - 3.0% ] 2.87% | 4,493 | 8.8% |
[ 3.5% - 4.0% ] 3.56% | 3,622 | 9.1% |
[ 3.5% - 4.0% ] 3.67% | 1,936 | 8.5% |