Immigrants from Senegal Seniors Poverty Over the Age of 75

COMPARE

Immigrants from Senegal
Race
Ancestry
AfghanAfricanAlaska NativeAlaskan AthabascanAlbanianAleutAlsatianAmericanApacheArabArapahoArgentineanArmenianAssyrian/Chaldean/SyriacAustralianAustrianBahamianBangladeshiBarbadianBasqueBelgianBelizeanBermudanBhutaneseBlackfeetBolivianBrazilianBritishBritish West IndianBulgarianBurmeseCajunCambodianCanadianCape VerdeanCarpatho RusynCelticCentral AmericanCentral American IndianCherokeeCheyenneChickasawChileanChineseChippewaChoctawColombianColvilleComancheCosta RicanCreeCreekCroatianCrowCubanCypriotCzechCzechoslovakianDanishDelawareDominicanDutchDutch West IndianEastern EuropeanEcuadorianEgyptianEnglishEstonianEthiopianEuropeanFijianFilipinoFinnishFrenchFrench American IndianFrench CanadianGermanGerman RussianGhanaianGreekGuamanian/ChamorroGuatemalanGuyaneseHaitianHmongHonduranHopiHoumaHungarianIcelanderIndian (Asian)IndonesianInupiatIranianIraqiIrishIroquoisIsraeliItalianJamaicanJapaneseJordanianKenyanKiowaKoreanLaotianLatvianLebaneseLiberianLithuanianLumbeeLuxembourgerMacedonianMalaysianMalteseMarshalleseMenomineeMexicanMexican American IndianMongolianMoroccanNative HawaiianNavajoNepaleseNew ZealanderNicaraguanNigerianNorthern EuropeanNorwegianOkinawanOsageOttawaPaiutePakistaniPalestinianPanamanianParaguayanPennsylvania GermanPeruvianPimaPolishPortuguesePotawatomiPuebloPuerto RicanPuget Sound SalishRomanianRussianSalvadoranSamoanScandinavianScotch-IrishScottishSeminoleSenegaleseSerbianShoshoneSierra LeoneanSiouxSlavicSlovakSloveneSomaliSouth AfricanSouth AmericanSouth American IndianSoviet UnionSpaniardSpanishSpanish AmericanSpanish American IndianSri LankanSubsaharan AfricanSudaneseSwedishSwissSyrianTaiwaneseThaiTlingit-HaidaTohono O'OdhamTonganTrinidadian and TobagonianTsimshianTurkishU.S. Virgin IslanderUgandanUkrainianUruguayanUteVenezuelanVietnameseWelshWest IndianYakamaYaquiYugoslavianYumanYup'ikZimbabwean
Immigration
NonimmigrantsImmigrantsAfghanistanAfricaAlbaniaArgentinaArmeniaAsiaAustraliaAustriaBahamasBangladeshBarbadosBelarusBelgiumBelizeBoliviaBosnia and HerzegovinaBrazilBulgariaBurma/MyanmarCabo VerdeCambodiaCameroonCanadaCaribbeanCentral AmericaChileChinaColombiaCongoCosta RicaCroatiaCubaCzechoslovakiaDenmarkDominicaDominican RepublicEastern AfricaEastern AsiaEastern EuropeEcuadorEgyptEl SalvadorEnglandEritreaEthiopiaEuropeFijiFranceGermanyGhanaGreeceGrenadaGuatemalaGuyanaHaitiHondurasHong KongHungaryIndiaIndonesiaIranIraqIrelandIsraelItalyJamaicaJapanJordanKazakhstanKenyaKoreaKuwaitLaosLatin AmericaLatviaLebanonLiberiaLithuaniaMalaysiaMexicoMicronesiaMiddle AfricaMoldovaMoroccoNepalNetherlandsNicaraguaNigeriaNorth AmericaNorth MacedoniaNorthern AfricaNorthern EuropeNorwayOceaniaPakistanPanamaPeruPhilippinesPolandPortugalRomaniaRussiaSaudi ArabiaScotlandSenegalSerbiaSierra LeoneSingaporeSomaliaSouth AfricaSouth AmericaSouth Central AsiaSouth Eastern AsiaSouthern EuropeSpainSri LankaSt. Vincent and the GrenadinesSudanSwedenSwitzerlandSyriaTaiwanThailandTrinidad and TobagoTurkeyUgandaUkraineUruguayUzbekistanVenezuelaVietnamWest IndiesWestern AfricaWestern AsiaWestern EuropeYemenZaireZimbabweAzores
Select to Compare
Race
Ancestry
AfghanAfricanAlaska NativeAlaskan AthabascanAlbanianAleutAlsatianAmericanApacheArabArapahoArgentineanArmenianAssyrian/Chaldean/SyriacAustralianAustrianBahamianBangladeshiBarbadianBasqueBelgianBelizeanBermudanBhutaneseBlackfeetBolivianBrazilianBritishBritish West IndianBulgarianBurmeseCajunCambodianCanadianCape VerdeanCarpatho RusynCelticCentral AmericanCentral American IndianCherokeeCheyenneChickasawChileanChineseChippewaChoctawColombianColvilleComancheCosta RicanCreeCreekCroatianCrowCubanCypriotCzechCzechoslovakianDanishDelawareDominicanDutchDutch West IndianEastern EuropeanEcuadorianEgyptianEnglishEstonianEthiopianEuropeanFijianFilipinoFinnishFrenchFrench American IndianFrench CanadianGermanGerman RussianGhanaianGreekGuamanian/ChamorroGuatemalanGuyaneseHaitianHmongHonduranHopiHoumaHungarianIcelanderIndian (Asian)IndonesianInupiatIranianIraqiIrishIroquoisIsraeliItalianJamaicanJapaneseJordanianKenyanKiowaKoreanLaotianLatvianLebaneseLiberianLithuanianLumbeeLuxembourgerMacedonianMalaysianMalteseMarshalleseMenomineeMexicanMexican American IndianMongolianMoroccanNative HawaiianNavajoNepaleseNew ZealanderNicaraguanNigerianNorthern EuropeanNorwegianOkinawanOsageOttawaPaiutePakistaniPalestinianPanamanianParaguayanPennsylvania GermanPeruvianPimaPolishPortuguesePotawatomiPuebloPuerto RicanPuget Sound SalishRomanianRussianSalvadoranSamoanScandinavianScotch-IrishScottishSeminoleSenegaleseSerbianShoshoneSierra LeoneanSiouxSlavicSlovakSloveneSomaliSouth AfricanSouth AmericanSouth American IndianSoviet UnionSpaniardSpanishSpanish AmericanSpanish American IndianSri LankanSubsaharan AfricanSudaneseSwedishSwissSyrianTaiwaneseThaiTlingit-HaidaTohono O'OdhamTonganTrinidadian and TobagonianTsimshianTurkishU.S. Virgin IslanderUgandanUkrainianUruguayanUteVenezuelanVietnameseWelshWest IndianYakamaYaquiYugoslavianYumanYup'ikZimbabwean
Immigration
NonimmigrantsImmigrantsAfghanistanAfricaAlbaniaArgentinaArmeniaAsiaAustraliaAustriaBahamasBangladeshBarbadosBelarusBelgiumBelizeBoliviaBosnia and HerzegovinaBrazilBulgariaBurma/MyanmarCabo VerdeCambodiaCameroonCanadaCaribbeanCentral AmericaChileChinaColombiaCongoCosta RicaCroatiaCubaCzechoslovakiaDenmarkDominicaDominican RepublicEastern AfricaEastern AsiaEastern EuropeEcuadorEgyptEl SalvadorEnglandEritreaEthiopiaEuropeFijiFranceGermanyGhanaGreeceGrenadaGuatemalaGuyanaHaitiHondurasHong KongHungaryIndiaIndonesiaIranIraqIrelandIsraelItalyJamaicaJapanJordanKazakhstanKenyaKoreaKuwaitLaosLatin AmericaLatviaLebanonLiberiaLithuaniaMalaysiaMexicoMicronesiaMiddle AfricaMoldovaMoroccoNepalNetherlandsNicaraguaNigeriaNorth AmericaNorth MacedoniaNorthern AfricaNorthern EuropeNorwayOceaniaPakistanPanamaPeruPhilippinesPolandPortugalRomaniaRussiaSaudi ArabiaScotlandSerbiaSierra LeoneSingaporeSomaliaSouth AfricaSouth AmericaSouth Central AsiaSouth Eastern AsiaSouthern EuropeSpainSri LankaSt. Vincent and the GrenadinesSudanSwedenSwitzerlandSyriaTaiwanThailandTrinidad and TobagoTurkeyUgandaUkraineUruguayUzbekistanVenezuelaVietnamWest IndiesWestern AfricaWestern AsiaWestern EuropeYemenZaireZimbabweAzores
Seniors Poverty Over the Age of 75
Income
Poverty
Unemployment
Labor Participation
Family Structure
Vehicle Availability
Education Level
Disability

Immigrants from Senegal Seniors Poverty Over the Age of 75
Tragic

14.8%
POVERTY | SENIORS > 75
0.0/ 100
METRIC RATING
282nd/ 347
METRIC RANK

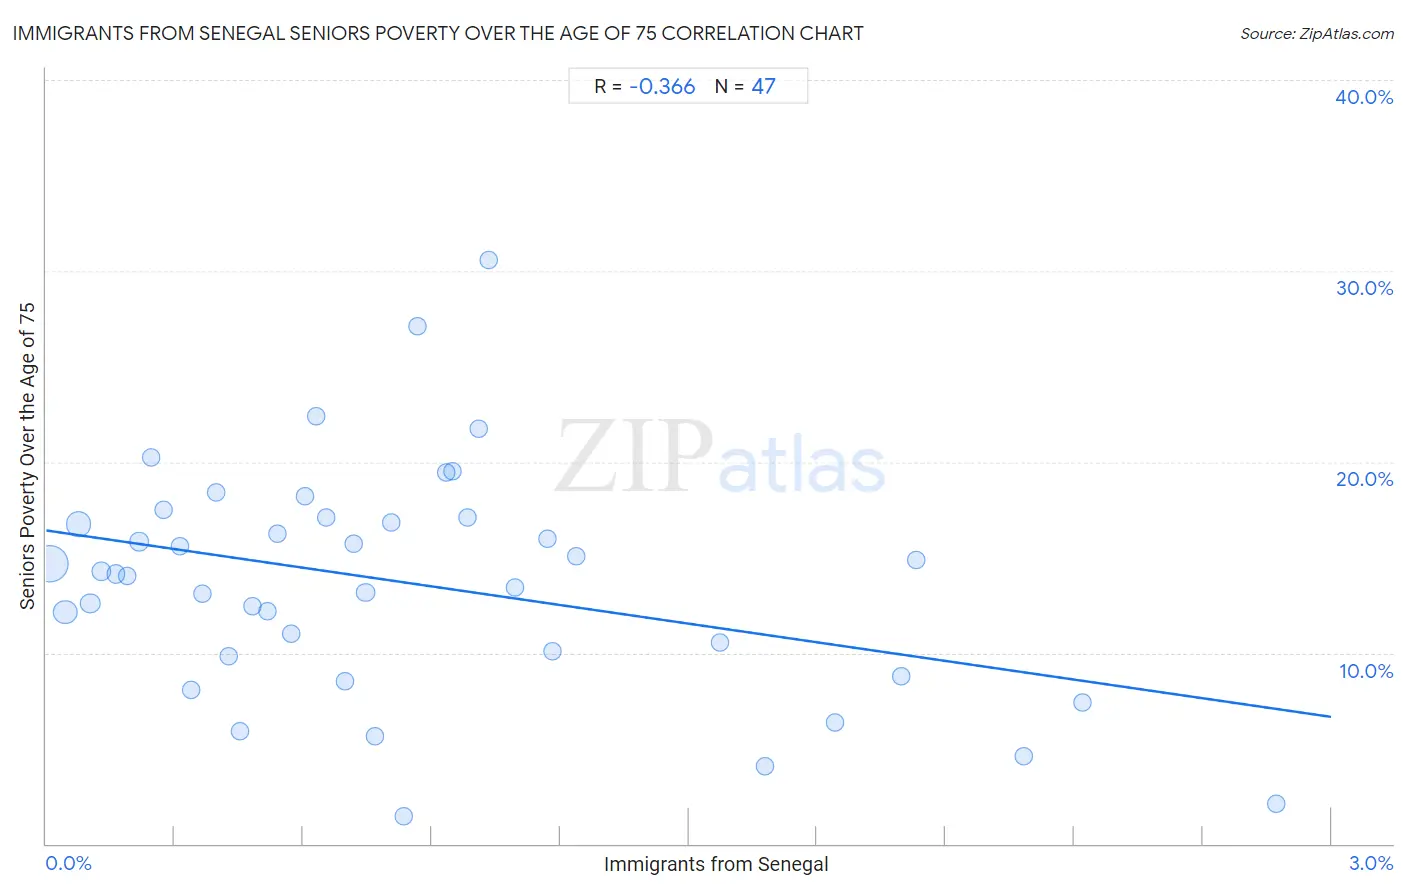
Immigrants from Senegal Seniors Poverty Over the Age of 75 Correlation Chart

The statistical analysis conducted on geographies consisting of 89,840,643 people shows a mild negative correlation between the proportion of Immigrants from Senegal and poverty level among seniors over the age of 75 in the United States with a correlation coefficient (R) of -0.366 and weighted average of 14.8%. On average, for every 1% (one percent) increase in Immigrants from Senegal within a typical geography, there is a decrease of 3.3% in poverty level among seniors over the age of 75.
Immigrants from Senegal Seniors Poverty Over the Age of 75
It is essential to understand that the correlation between the percentage of Immigrants from Senegal and poverty level among seniors over the age of 75 does not imply a direct cause-and-effect relationship. It remains uncertain whether the presence of Immigrants from Senegal influences an upward or downward trend in the level of poverty level among seniors over the age of 75 within an area, or if Immigrants from Senegal simply ended up residing in those areas with higher or lower levels of poverty level among seniors over the age of 75 due to other factors.

Demographics Similar to Immigrants from Senegal by Seniors Poverty Over the Age of 75

In terms of seniors poverty over the age of 75, the demographic groups most similar to Immigrants from Senegal are Guatemalan (14.8%, a difference of 0.060%), Belizean (14.8%, a difference of 0.18%), Central American (14.7%, a difference of 0.29%), Cheyenne (14.9%, a difference of 0.70%), and Immigrants from Mexico (14.9%, a difference of 0.89%).
DemographicsRating | RankSeniors Poverty Over the Age of 75
Immigrants from El Salvador
0.0
/100
|
#275
Tragic
14.5%
Soviet Union
0.0
/100
|
#276
Tragic
14.5%
Senegalese
0.0
/100
|
#277
Tragic
14.5%
Immigrants from Colombia
0.0
/100
|
#278
Tragic
14.6%
Blacks/African Americans
0.0
/100
|
#279
Tragic
14.6%
Central Americans
0.0
/100
|
#280
Tragic
14.7%
Belizeans
0.0
/100
|
#281
Tragic
14.8%
Immigrants from Senegal
0.0
/100
|
#282
Tragic
14.8%
Guatemalans
0.0
/100
|
#283
Tragic
14.8%
Cheyenne
0.0
/100
|
#284
Tragic
14.9%
Immigrants from Mexico
0.0
/100
|
#285
Tragic
14.9%
Immigrants from Central America
0.0
/100
|
#286
Tragic
15.0%
Immigrants from Guatemala
0.0
/100
|
#287
Tragic
15.1%
Jamaicans
0.0
/100
|
#288
Tragic
15.1%
Immigrants from Belize
0.0
/100
|
#289
Tragic
15.2%

Immigrants from Senegal Seniors Poverty Over the Age of 75 Correlation Summary

MeasurementImmigrants from Senegal DataSeniors Poverty Over the Age of 75 Data
Minimum0.0099%1.5%
Maximum2.9%30.6%
Range2.9%29.1%
Mean0.84%13.7%
Median0.70%14.1%
Interquartile 25% (IQ1)0.34%9.8%
Interquartile 75% (IQ3)1.1%17.1%
Interquartile Range (IQR)0.76%7.2%
Standard Deviation (Sample)0.68%6.0%
Standard Deviation (Population)0.67%5.9%

Correlation Details

Immigrants from Senegal PercentileSample SizeSeniors Poverty Over the Age of 75
[
0.0%
-
0.5%
]
0.0099%
44,150,96314.7%
[
0.0%
-
0.5%
]
0.045%
13,480,44012.1%
[
0.0%
-
0.5%
]
0.076%
15,703,09216.7%
[
0.0%
-
0.5%
]
0.10%
4,704,51012.6%
[
0.0%
-
0.5%
]
0.13%
2,642,53914.3%
[
0.0%
-
0.5%
]
0.16%
1,884,02814.1%
[
0.0%
-
0.5%
]
0.19%
1,414,79814.0%
[
0.0%
-
0.5%
]
0.22%
983,12915.8%
[
0.0%
-
0.5%
]
0.25%
361,27420.2%
[
0.0%
-
0.5%
]
0.27%
761,52117.5%
[
0.0%
-
0.5%
]
0.31%
255,89015.6%
[
0.0%
-
0.5%
]
0.34%
385,8148.1%
[
0.0%
-
0.5%
]
0.37%
285,65713.1%
[
0.0%
-
0.5%
]
0.40%
379,70118.4%
[
0.0%
-
0.5%
]
0.43%
189,9889.8%
[
0.0%
-
0.5%
]
0.45%
174,0415.9%
[
0.0%
-
0.5%
]
0.48%
143,44312.5%
[
0.5%
-
1.0%
]
0.52%
163,39912.2%
[
0.5%
-
1.0%
]
0.54%
236,18616.3%
[
0.5%
-
1.0%
]
0.57%
198,69511.0%
[
0.5%
-
1.0%
]
0.60%
123,43918.2%
[
0.5%
-
1.0%
]
0.63%
262,16322.4%
[
0.5%
-
1.0%
]
0.65%
118,39717.1%
[
0.5%
-
1.0%
]
0.70%
32,5048.5%
[
0.5%
-
1.0%
]
0.72%
154,23715.7%
[
0.5%
-
1.0%
]
0.75%
94,69213.1%
[
0.5%
-
1.0%
]
0.77%
36,4485.7%
[
0.5%
-
1.0%
]
0.80%
124,50416.9%
[
0.5%
-
1.0%
]
0.84%
10,5271.5%
[
0.5%
-
1.0%
]
0.87%
24,84227.1%
[
0.5%
-
1.0%
]
0.93%
5,88419.5%
[
0.5%
-
1.0%
]
0.95%
63,10419.5%
[
0.5%
-
1.0%
]
0.98%
18,09117.1%
[
1.0%
-
1.5%
]
1.01%
63,93821.7%
[
1.0%
-
1.5%
]
1.03%
15,48930.6%
[
1.0%
-
1.5%
]
1.09%
21,93713.4%
[
1.0%
-
1.5%
]
1.17%
53,01216.0%
[
1.0%
-
1.5%
]
1.18%
20,90310.1%
[
1.0%
-
1.5%
]
1.24%
38,23515.1%
[
1.5%
-
2.0%
]
1.57%
19,06910.5%
[
1.5%
-
2.0%
]
1.68%
3,5754.1%
[
1.5%
-
2.0%
]
1.84%
3,3656.4%
[
1.5%
-
2.0%
]
2.00%
13,3238.8%
[
2.0%
-
2.5%
]
2.03%
3,49714.9%
[
2.0%
-
2.5%
]
2.28%
8764.6%
[
2.0%
-
2.5%
]
2.42%
10,9917.4%
[
2.5%
-
3.0%
]
2.87%
4,4932.1%