Immigrants from Panama 3 or more Vehicles in Household
COMPARE
Immigrants from Panama
Select to Compare
3 or more Vehicles in Household
Immigrants from Panama 3 or more Vehicles in Household
17.7%
3+ VEHICLES AVAILABLE
0.8/ 100
METRIC RATING
265th/ 347
METRIC RANK
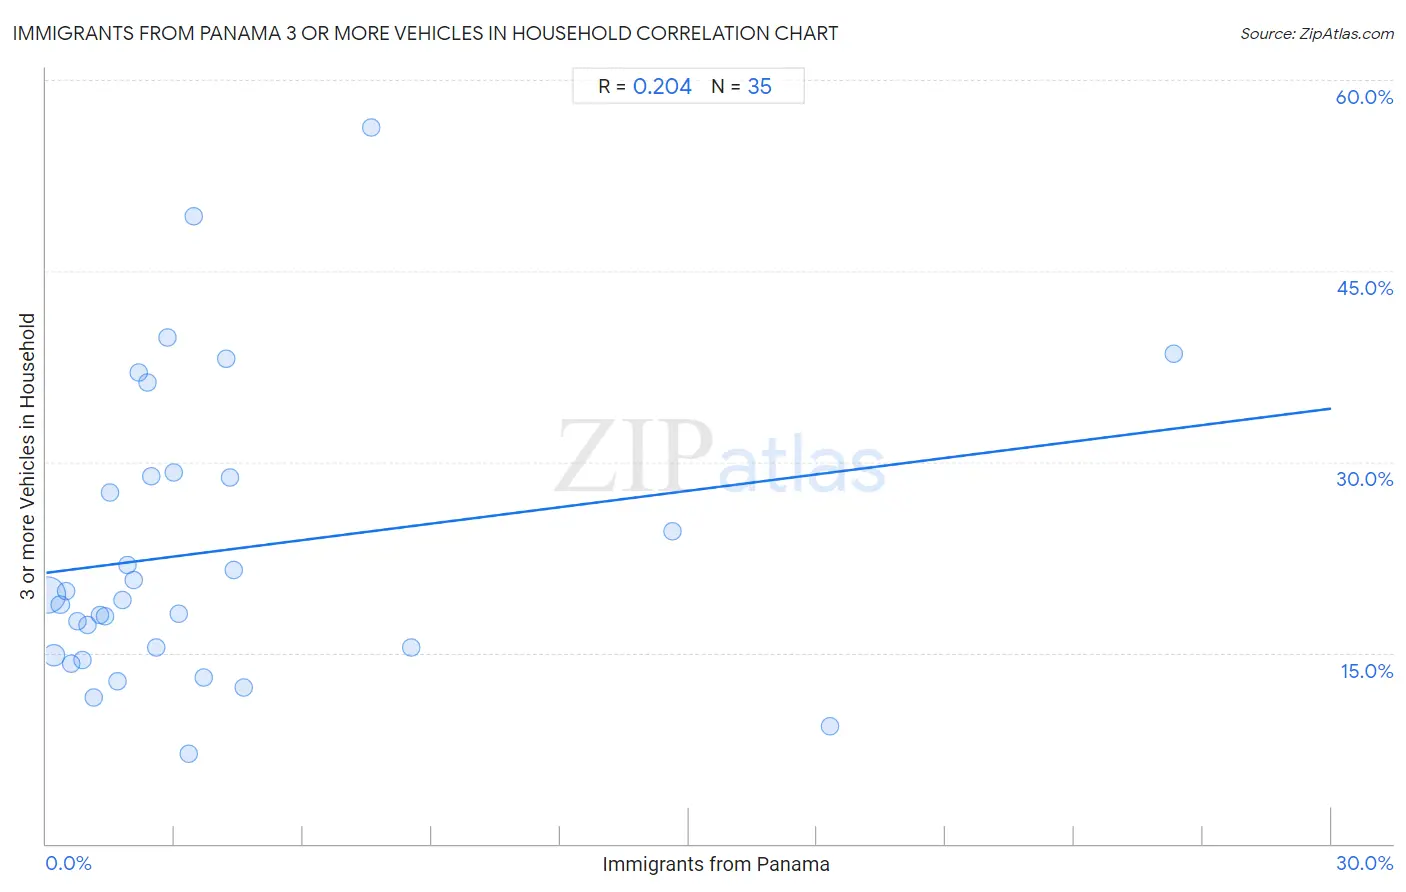
Immigrants from Panama 3 or more Vehicles in Household Correlation Chart
The statistical analysis conducted on geographies consisting of 221,149,487 people shows a weak positive correlation between the proportion of Immigrants from Panama and percentage of households with 3 or more vehicles available in the United States with a correlation coefficient (R) of 0.204 and weighted average of 17.7%. On average, for every 1% (one percent) increase in Immigrants from Panama within a typical geography, there is an increase of 0.43% in percentage of households with 3 or more vehicles available.
It is essential to understand that the correlation between the percentage of Immigrants from Panama and percentage of households with 3 or more vehicles available does not imply a direct cause-and-effect relationship. It remains uncertain whether the presence of Immigrants from Panama influences an upward or downward trend in the level of percentage of households with 3 or more vehicles available within an area, or if Immigrants from Panama simply ended up residing in those areas with higher or lower levels of percentage of households with 3 or more vehicles available due to other factors.
Demographics Similar to Immigrants from Panama by 3 or more Vehicles in Household
In terms of 3 or more vehicles in household, the demographic groups most similar to Immigrants from Panama are Macedonian (17.7%, a difference of 0.020%), Immigrants from Venezuela (17.7%, a difference of 0.080%), Immigrants from Bulgaria (17.7%, a difference of 0.090%), Cambodian (17.8%, a difference of 0.14%), and Bermudan (17.8%, a difference of 0.16%).
| Demographics | Rating | Rank | 3 or more Vehicles in Household |
| Sudanese | 1.1 /100 | #258 | Tragic 17.8% |
| Uruguayans | 1.0 /100 | #259 | Tragic 17.8% |
| Ugandans | 0.9 /100 | #260 | Tragic 17.8% |
| Immigrants from Northern Africa | 0.9 /100 | #261 | Tragic 17.8% |
| Colombians | 0.9 /100 | #262 | Tragic 17.8% |
| Bermudans | 0.9 /100 | #263 | Tragic 17.8% |
| Cambodians | 0.9 /100 | #264 | Tragic 17.8% |
| Immigrants from Panama | 0.8 /100 | #265 | Tragic 17.7% |
| Macedonians | 0.8 /100 | #266 | Tragic 17.7% |
| Immigrants from Venezuela | 0.8 /100 | #267 | Tragic 17.7% |
| Immigrants from Bulgaria | 0.8 /100 | #268 | Tragic 17.7% |
| Immigrants from France | 0.6 /100 | #269 | Tragic 17.6% |
| Immigrants from Nepal | 0.6 /100 | #270 | Tragic 17.6% |
| South Americans | 0.6 /100 | #271 | Tragic 17.6% |
| Immigrants from Africa | 0.5 /100 | #272 | Tragic 17.6% |
Immigrants from Panama 3 or more Vehicles in Household Correlation Summary
| Measurement | Immigrants from Panama Data | 3 or more Vehicles in Household Data |
| Minimum | 0.042% | 7.1% |
| Maximum | 26.3% | 56.2% |
| Range | 26.3% | 49.1% |
| Mean | 4.0% | 23.0% |
| Median | 2.4% | 19.1% |
| Interquartile 25% (IQ1) | 1.1% | 14.8% |
| Interquartile 75% (IQ3) | 4.2% | 28.9% |
| Interquartile Range (IQR) | 3.1% | 14.1% |
| Standard Deviation (Sample) | 5.4% | 11.5% |
| Standard Deviation (Population) | 5.4% | 11.3% |
Correlation Details
| Immigrants from Panama Percentile | Sample Size | 3 or more Vehicles in Household |
[ 0.0% - 0.5% ] 0.042% | 177,245,340 | 19.6% |
[ 0.0% - 0.5% ] 0.18% | 30,554,263 | 14.8% |
[ 0.0% - 0.5% ] 0.32% | 6,804,266 | 18.8% |
[ 0.0% - 0.5% ] 0.45% | 3,119,559 | 19.9% |
[ 0.5% - 1.0% ] 0.59% | 1,462,012 | 14.1% |
[ 0.5% - 1.0% ] 0.73% | 910,318 | 17.5% |
[ 0.5% - 1.0% ] 0.85% | 293,776 | 14.4% |
[ 0.5% - 1.0% ] 0.96% | 254,375 | 17.1% |
[ 1.0% - 1.5% ] 1.10% | 170,828 | 11.5% |
[ 1.0% - 1.5% ] 1.24% | 166,621 | 18.0% |
[ 1.0% - 1.5% ] 1.36% | 4,396 | 17.9% |
[ 1.0% - 1.5% ] 1.49% | 34,226 | 27.6% |
[ 1.5% - 2.0% ] 1.66% | 18,765 | 12.7% |
[ 1.5% - 2.0% ] 1.78% | 37,508 | 19.1% |
[ 1.5% - 2.0% ] 1.90% | 1,841 | 21.9% |
[ 2.0% - 2.5% ] 2.03% | 24,413 | 20.7% |
[ 2.0% - 2.5% ] 2.17% | 4,105 | 37.0% |
[ 2.0% - 2.5% ] 2.36% | 19,216 | 36.2% |
[ 2.0% - 2.5% ] 2.47% | 1,460 | 28.9% |
[ 2.5% - 3.0% ] 2.57% | 3,775 | 15.5% |
[ 2.5% - 3.0% ] 2.84% | 1,653 | 39.8% |
[ 2.5% - 3.0% ] 2.97% | 1,247 | 29.2% |
[ 3.0% - 3.5% ] 3.11% | 644 | 18.1% |
[ 3.0% - 3.5% ] 3.33% | 7,299 | 7.1% |
[ 3.0% - 3.5% ] 3.45% | 522 | 49.3% |
[ 3.5% - 4.0% ] 3.66% | 2,183 | 13.1% |
[ 4.0% - 4.5% ] 4.19% | 1,002 | 38.1% |
[ 4.0% - 4.5% ] 4.28% | 1,332 | 28.8% |
[ 4.0% - 4.5% ] 4.37% | 183 | 21.5% |
[ 4.5% - 5.0% ] 4.62% | 1,385 | 12.3% |
[ 7.5% - 8.0% ] 7.59% | 514 | 56.2% |
[ 8.5% - 9.0% ] 8.51% | 47 | 15.4% |
[ 14.5% - 15.0% ] 14.61% | 219 | 24.6% |
[ 18.0% - 18.5% ] 18.29% | 175 | 9.3% |
[ 26.0% - 26.5% ] 26.32% | 19 | 38.5% |