Immigrants from Panama Disability
COMPARE
Immigrants from Panama
Select to Compare
Disability
Immigrants from Panama Disability
11.9%
DISABILITY
14.6/ 100
METRIC RATING
199th/ 347
METRIC RANK
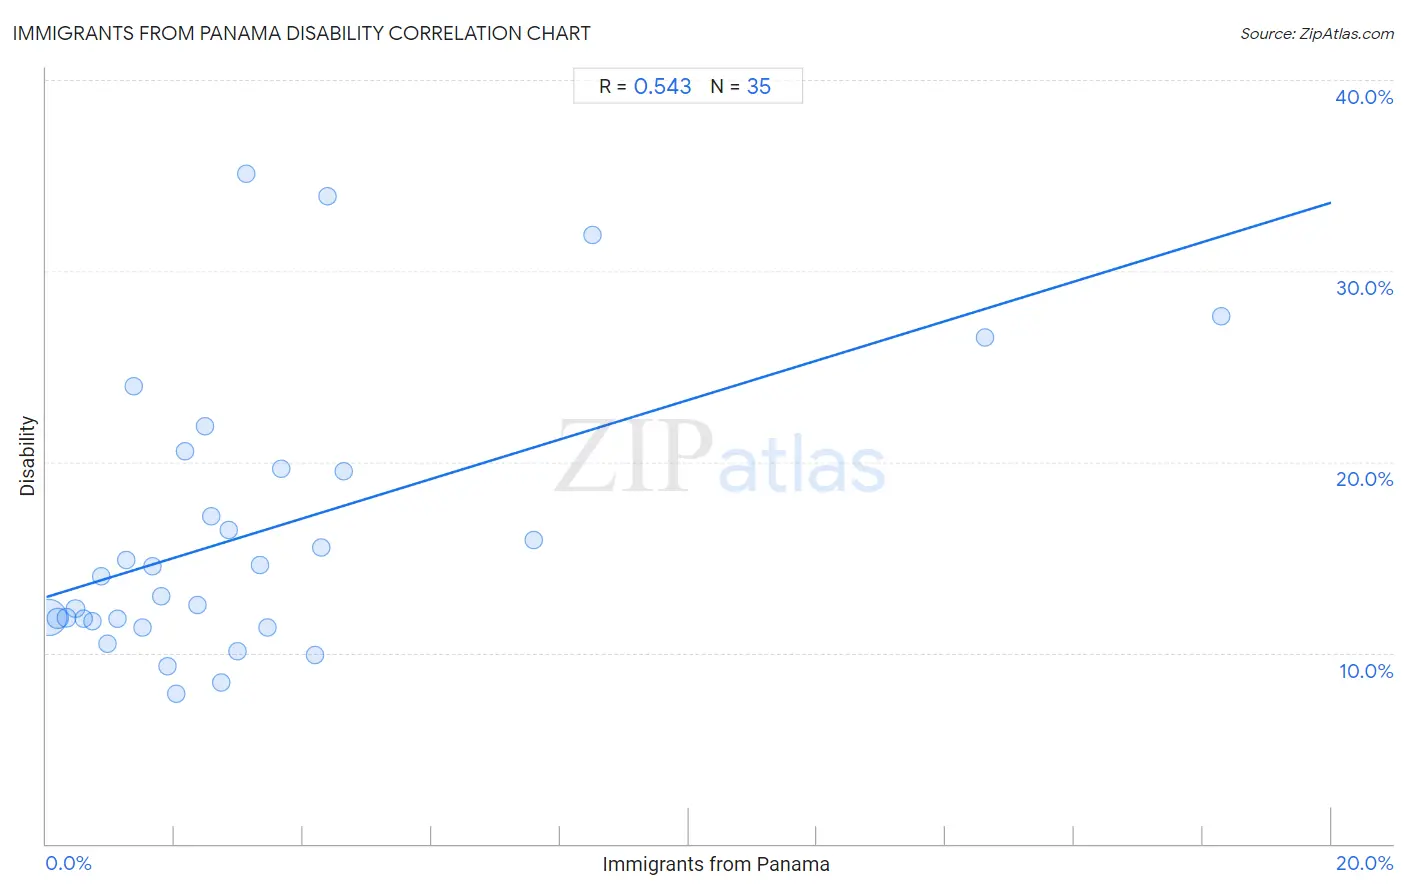
Immigrants from Panama Disability Correlation Chart
The statistical analysis conducted on geographies consisting of 221,178,706 people shows a substantial positive correlation between the proportion of Immigrants from Panama and percentage of population with a disability in the United States with a correlation coefficient (R) of 0.543 and weighted average of 11.9%. On average, for every 1% (one percent) increase in Immigrants from Panama within a typical geography, there is an increase of 1.0% in percentage of population with a disability.
It is essential to understand that the correlation between the percentage of Immigrants from Panama and percentage of population with a disability does not imply a direct cause-and-effect relationship. It remains uncertain whether the presence of Immigrants from Panama influences an upward or downward trend in the level of percentage of population with a disability within an area, or if Immigrants from Panama simply ended up residing in those areas with higher or lower levels of percentage of population with a disability due to other factors.
Demographics Similar to Immigrants from Panama by Disability
In terms of disability, the demographic groups most similar to Immigrants from Panama are Ukrainian (11.9%, a difference of 0.010%), Immigrants from Belize (11.9%, a difference of 0.050%), Serbian (11.9%, a difference of 0.070%), Barbadian (11.9%, a difference of 0.10%), and Belizean (11.9%, a difference of 0.16%).
| Demographics | Rating | Rank | Disability |
| Lithuanians | 18.8 /100 | #192 | Poor 11.9% |
| Immigrants from Bosnia and Herzegovina | 18.0 /100 | #193 | Poor 11.9% |
| Somalis | 17.3 /100 | #194 | Poor 11.9% |
| Barbadians | 15.8 /100 | #195 | Poor 11.9% |
| Serbians | 15.4 /100 | #196 | Poor 11.9% |
| Immigrants from Belize | 15.2 /100 | #197 | Poor 11.9% |
| Ukrainians | 14.7 /100 | #198 | Poor 11.9% |
| Immigrants from Panama | 14.6 /100 | #199 | Poor 11.9% |
| Belizeans | 12.8 /100 | #200 | Poor 11.9% |
| Assyrians/Chaldeans/Syriacs | 12.6 /100 | #201 | Poor 11.9% |
| Immigrants from England | 12.0 /100 | #202 | Poor 12.0% |
| British West Indians | 11.5 /100 | #203 | Poor 12.0% |
| Mexican American Indians | 11.4 /100 | #204 | Poor 12.0% |
| Immigrants from Western Europe | 10.1 /100 | #205 | Poor 12.0% |
| Immigrants from Senegal | 9.4 /100 | #206 | Tragic 12.0% |
Immigrants from Panama Disability Correlation Summary
| Measurement | Immigrants from Panama Data | Disability Data |
| Minimum | 0.042% | 7.9% |
| Maximum | 18.3% | 35.1% |
| Range | 18.2% | 27.2% |
| Mean | 3.3% | 16.3% |
| Median | 2.4% | 14.0% |
| Interquartile 25% (IQ1) | 1.1% | 11.7% |
| Interquartile 75% (IQ3) | 3.7% | 19.7% |
| Interquartile Range (IQR) | 2.6% | 8.0% |
| Standard Deviation (Sample) | 3.8% | 7.3% |
| Standard Deviation (Population) | 3.8% | 7.2% |
Correlation Details
| Immigrants from Panama Percentile | Sample Size | Disability |
[ 0.0% - 0.5% ] 0.042% | 177,245,340 | 11.8% |
[ 0.0% - 0.5% ] 0.18% | 30,566,963 | 11.8% |
[ 0.0% - 0.5% ] 0.32% | 6,812,245 | 11.8% |
[ 0.0% - 0.5% ] 0.45% | 3,119,559 | 12.3% |
[ 0.5% - 1.0% ] 0.59% | 1,462,730 | 11.8% |
[ 0.5% - 1.0% ] 0.73% | 910,318 | 11.7% |
[ 0.5% - 1.0% ] 0.85% | 295,328 | 14.0% |
[ 0.5% - 1.0% ] 0.96% | 258,725 | 10.5% |
[ 1.0% - 1.5% ] 1.10% | 170,828 | 11.8% |
[ 1.0% - 1.5% ] 1.24% | 167,238 | 14.8% |
[ 1.0% - 1.5% ] 1.36% | 4,396 | 24.0% |
[ 1.0% - 1.5% ] 1.49% | 34,226 | 11.4% |
[ 1.5% - 2.0% ] 1.66% | 18,765 | 14.5% |
[ 1.5% - 2.0% ] 1.78% | 37,508 | 12.9% |
[ 1.5% - 2.0% ] 1.88% | 2,760 | 9.3% |
[ 2.0% - 2.5% ] 2.03% | 24,413 | 7.9% |
[ 2.0% - 2.5% ] 2.17% | 4,105 | 20.6% |
[ 2.0% - 2.5% ] 2.36% | 19,216 | 12.5% |
[ 2.0% - 2.5% ] 2.47% | 1,460 | 21.8% |
[ 2.5% - 3.0% ] 2.57% | 3,775 | 17.1% |
[ 2.5% - 3.0% ] 2.73% | 403 | 8.4% |
[ 2.5% - 3.0% ] 2.84% | 1,653 | 16.5% |
[ 2.5% - 3.0% ] 2.97% | 1,247 | 10.1% |
[ 3.0% - 3.5% ] 3.11% | 644 | 35.1% |
[ 3.0% - 3.5% ] 3.33% | 7,299 | 14.6% |
[ 3.0% - 3.5% ] 3.45% | 522 | 11.3% |
[ 3.5% - 4.0% ] 3.66% | 2,183 | 19.7% |
[ 4.0% - 4.5% ] 4.19% | 1,002 | 9.9% |
[ 4.0% - 4.5% ] 4.28% | 1,332 | 15.5% |
[ 4.0% - 4.5% ] 4.37% | 183 | 33.9% |
[ 4.5% - 5.0% ] 4.62% | 1,385 | 19.5% |
[ 7.5% - 8.0% ] 7.59% | 514 | 15.9% |
[ 8.5% - 9.0% ] 8.51% | 47 | 31.9% |
[ 14.5% - 15.0% ] 14.61% | 219 | 26.5% |
[ 18.0% - 18.5% ] 18.29% | 175 | 27.7% |