Immigrants from Panama 2 or more Vehicles in Household

COMPARE

Immigrants from Panama
Race
Ancestry
AfghanAfricanAlaska NativeAlaskan AthabascanAlbanianAleutAlsatianAmericanApacheArabArapahoArgentineanArmenianAssyrian/Chaldean/SyriacAustralianAustrianBahamianBangladeshiBarbadianBasqueBelgianBelizeanBermudanBhutaneseBlackfeetBolivianBrazilianBritishBritish West IndianBulgarianBurmeseCajunCambodianCanadianCape VerdeanCarpatho RusynCelticCentral AmericanCentral American IndianCherokeeCheyenneChickasawChileanChineseChippewaChoctawColombianColvilleComancheCosta RicanCreeCreekCroatianCrowCubanCypriotCzechCzechoslovakianDanishDelawareDominicanDutchDutch West IndianEastern EuropeanEcuadorianEgyptianEnglishEstonianEthiopianEuropeanFijianFilipinoFinnishFrenchFrench American IndianFrench CanadianGermanGerman RussianGhanaianGreekGuamanian/ChamorroGuatemalanGuyaneseHaitianHmongHonduranHopiHoumaHungarianIcelanderIndian (Asian)IndonesianInupiatIranianIraqiIrishIroquoisIsraeliItalianJamaicanJapaneseJordanianKenyanKiowaKoreanLaotianLatvianLebaneseLiberianLithuanianLumbeeLuxembourgerMacedonianMalaysianMalteseMarshalleseMenomineeMexicanMexican American IndianMongolianMoroccanNative HawaiianNavajoNepaleseNew ZealanderNicaraguanNigerianNorthern EuropeanNorwegianOkinawanOsageOttawaPaiutePakistaniPalestinianPanamanianParaguayanPennsylvania GermanPeruvianPimaPolishPortuguesePotawatomiPuebloPuerto RicanPuget Sound SalishRomanianRussianSalvadoranSamoanScandinavianScotch-IrishScottishSeminoleSenegaleseSerbianShoshoneSierra LeoneanSiouxSlavicSlovakSloveneSomaliSouth AfricanSouth AmericanSouth American IndianSoviet UnionSpaniardSpanishSpanish AmericanSpanish American IndianSri LankanSubsaharan AfricanSudaneseSwedishSwissSyrianTaiwaneseThaiTlingit-HaidaTohono O'OdhamTonganTrinidadian and TobagonianTsimshianTurkishU.S. Virgin IslanderUgandanUkrainianUruguayanUteVenezuelanVietnameseWelshWest IndianYakamaYaquiYugoslavianYumanYup'ikZimbabwean
Immigration
NonimmigrantsImmigrantsAfghanistanAfricaAlbaniaArgentinaArmeniaAsiaAustraliaAustriaBahamasBangladeshBarbadosBelarusBelgiumBelizeBoliviaBosnia and HerzegovinaBrazilBulgariaBurma/MyanmarCabo VerdeCambodiaCameroonCanadaCaribbeanCentral AmericaChileChinaColombiaCongoCosta RicaCroatiaCubaCzechoslovakiaDenmarkDominicaDominican RepublicEastern AfricaEastern AsiaEastern EuropeEcuadorEgyptEl SalvadorEnglandEritreaEthiopiaEuropeFijiFranceGermanyGhanaGreeceGrenadaGuatemalaGuyanaHaitiHondurasHong KongHungaryIndiaIndonesiaIranIraqIrelandIsraelItalyJamaicaJapanJordanKazakhstanKenyaKoreaKuwaitLaosLatin AmericaLatviaLebanonLiberiaLithuaniaMalaysiaMexicoMicronesiaMiddle AfricaMoldovaMoroccoNepalNetherlandsNicaraguaNigeriaNorth AmericaNorth MacedoniaNorthern AfricaNorthern EuropeNorwayOceaniaPakistanPanamaPeruPhilippinesPolandPortugalRomaniaRussiaSaudi ArabiaScotlandSenegalSerbiaSierra LeoneSingaporeSomaliaSouth AfricaSouth AmericaSouth Central AsiaSouth Eastern AsiaSouthern EuropeSpainSri LankaSt. Vincent and the GrenadinesSudanSwedenSwitzerlandSyriaTaiwanThailandTrinidad and TobagoTurkeyUgandaUkraineUruguayUzbekistanVenezuelaVietnamWest IndiesWestern AfricaWestern AsiaWestern EuropeYemenZaireZimbabweAzores
Select to Compare
Race
Ancestry
AfghanAfricanAlaska NativeAlaskan AthabascanAlbanianAleutAlsatianAmericanApacheArabArapahoArgentineanArmenianAssyrian/Chaldean/SyriacAustralianAustrianBahamianBangladeshiBarbadianBasqueBelgianBelizeanBermudanBhutaneseBlackfeetBolivianBrazilianBritishBritish West IndianBulgarianBurmeseCajunCambodianCanadianCape VerdeanCarpatho RusynCelticCentral AmericanCentral American IndianCherokeeCheyenneChickasawChileanChineseChippewaChoctawColombianColvilleComancheCosta RicanCreeCreekCroatianCrowCubanCypriotCzechCzechoslovakianDanishDelawareDominicanDutchDutch West IndianEastern EuropeanEcuadorianEgyptianEnglishEstonianEthiopianEuropeanFijianFilipinoFinnishFrenchFrench American IndianFrench CanadianGermanGerman RussianGhanaianGreekGuamanian/ChamorroGuatemalanGuyaneseHaitianHmongHonduranHopiHoumaHungarianIcelanderIndian (Asian)IndonesianInupiatIranianIraqiIrishIroquoisIsraeliItalianJamaicanJapaneseJordanianKenyanKiowaKoreanLaotianLatvianLebaneseLiberianLithuanianLumbeeLuxembourgerMacedonianMalaysianMalteseMarshalleseMenomineeMexicanMexican American IndianMongolianMoroccanNative HawaiianNavajoNepaleseNew ZealanderNicaraguanNigerianNorthern EuropeanNorwegianOkinawanOsageOttawaPaiutePakistaniPalestinianPanamanianParaguayanPennsylvania GermanPeruvianPimaPolishPortuguesePotawatomiPuebloPuerto RicanPuget Sound SalishRomanianRussianSalvadoranSamoanScandinavianScotch-IrishScottishSeminoleSenegaleseSerbianShoshoneSierra LeoneanSiouxSlavicSlovakSloveneSomaliSouth AfricanSouth AmericanSouth American IndianSoviet UnionSpaniardSpanishSpanish AmericanSpanish American IndianSri LankanSubsaharan AfricanSudaneseSwedishSwissSyrianTaiwaneseThaiTlingit-HaidaTohono O'OdhamTonganTrinidadian and TobagonianTsimshianTurkishU.S. Virgin IslanderUgandanUkrainianUruguayanUteVenezuelanVietnameseWelshWest IndianYakamaYaquiYugoslavianYumanYup'ikZimbabwean
Immigration
NonimmigrantsImmigrantsAfghanistanAfricaAlbaniaArgentinaArmeniaAsiaAustraliaAustriaBahamasBangladeshBarbadosBelarusBelgiumBelizeBoliviaBosnia and HerzegovinaBrazilBulgariaBurma/MyanmarCabo VerdeCambodiaCameroonCanadaCaribbeanCentral AmericaChileChinaColombiaCongoCosta RicaCroatiaCubaCzechoslovakiaDenmarkDominicaDominican RepublicEastern AfricaEastern AsiaEastern EuropeEcuadorEgyptEl SalvadorEnglandEritreaEthiopiaEuropeFijiFranceGermanyGhanaGreeceGrenadaGuatemalaGuyanaHaitiHondurasHong KongHungaryIndiaIndonesiaIranIraqIrelandIsraelItalyJamaicaJapanJordanKazakhstanKenyaKoreaKuwaitLaosLatin AmericaLatviaLebanonLiberiaLithuaniaMalaysiaMexicoMicronesiaMiddle AfricaMoldovaMoroccoNepalNetherlandsNicaraguaNigeriaNorth AmericaNorth MacedoniaNorthern AfricaNorthern EuropeNorwayOceaniaPakistanPeruPhilippinesPolandPortugalRomaniaRussiaSaudi ArabiaScotlandSenegalSerbiaSierra LeoneSingaporeSomaliaSouth AfricaSouth AmericaSouth Central AsiaSouth Eastern AsiaSouthern EuropeSpainSri LankaSt. Vincent and the GrenadinesSudanSwedenSwitzerlandSyriaTaiwanThailandTrinidad and TobagoTurkeyUgandaUkraineUruguayUzbekistanVenezuelaVietnamWest IndiesWestern AfricaWestern AsiaWestern EuropeYemenZaireZimbabweAzores
2 or more Vehicles in Household
Income
Poverty
Unemployment
Labor Participation
Family Structure
Vehicle Availability
Education Level
Disability

Immigrants from Panama 2 or more Vehicles in Household
Tragic

51.1%
2+ VEHICLES AVAILABLE
0.0/ 100
METRIC RATING
290th/ 347
METRIC RANK

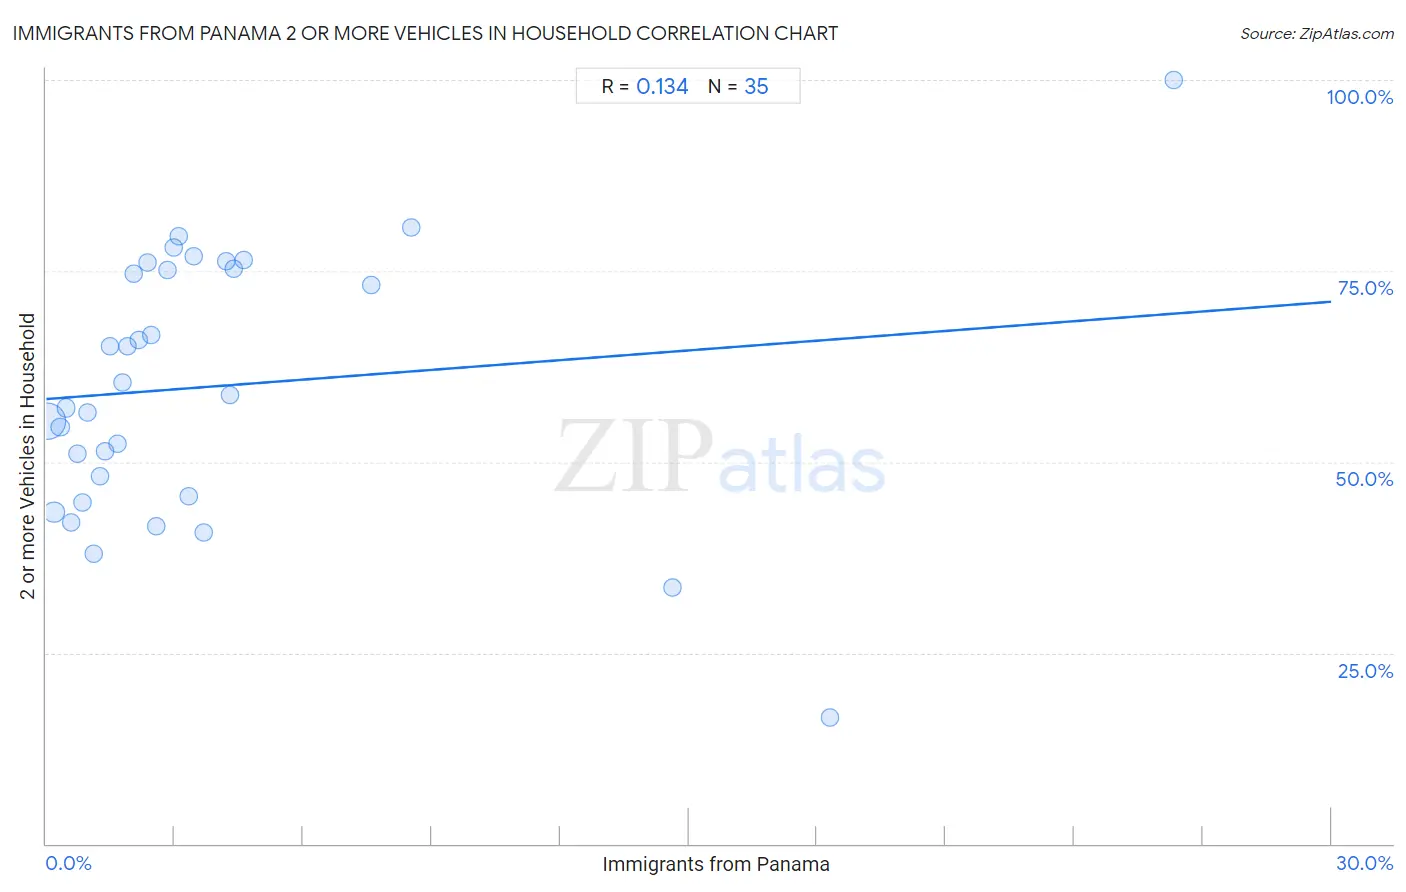
Immigrants from Panama 2 or more Vehicles in Household Correlation Chart

The statistical analysis conducted on geographies consisting of 221,156,465 people shows a poor positive correlation between the proportion of Immigrants from Panama and percentage of households with 2 or more vehicles available in the United States with a correlation coefficient (R) of 0.134 and weighted average of 51.1%. On average, for every 1% (one percent) increase in Immigrants from Panama within a typical geography, there is an increase of 0.42% in percentage of households with 2 or more vehicles available.
Immigrants from Panama 2 or more Vehicles in Household
It is essential to understand that the correlation between the percentage of Immigrants from Panama and percentage of households with 2 or more vehicles available does not imply a direct cause-and-effect relationship. It remains uncertain whether the presence of Immigrants from Panama influences an upward or downward trend in the level of percentage of households with 2 or more vehicles available within an area, or if Immigrants from Panama simply ended up residing in those areas with higher or lower levels of percentage of households with 2 or more vehicles available due to other factors.

Demographics Similar to Immigrants from Panama by 2 or more Vehicles in Household

In terms of 2 or more vehicles in household, the demographic groups most similar to Immigrants from Panama are Belizean (51.0%, a difference of 0.030%), Somali (51.1%, a difference of 0.060%), Okinawan (51.2%, a difference of 0.35%), Immigrants from Ukraine (50.9%, a difference of 0.36%), and Black/African American (50.9%, a difference of 0.37%).
DemographicsRating | Rank2 or more Vehicles in Household
Immigrants from China
0.1
/100
|
#283
Tragic
51.5%
Immigrants from Zaire
0.1
/100
|
#284
Tragic
51.5%
Immigrants from Uruguay
0.1
/100
|
#285
Tragic
51.4%
Immigrants from Liberia
0.1
/100
|
#286
Tragic
51.3%
Immigrants from Serbia
0.1
/100
|
#287
Tragic
51.3%
Okinawans
0.1
/100
|
#288
Tragic
51.2%
Somalis
0.0
/100
|
#289
Tragic
51.1%
Immigrants from Panama
0.0
/100
|
#290
Tragic
51.1%
Belizeans
0.0
/100
|
#291
Tragic
51.0%
Immigrants from Ukraine
0.0
/100
|
#292
Tragic
50.9%
Blacks/African Americans
0.0
/100
|
#293
Tragic
50.9%
Bermudans
0.0
/100
|
#294
Tragic
50.6%
Cypriots
0.0
/100
|
#295
Tragic
50.6%
Immigrants from Somalia
0.0
/100
|
#296
Tragic
50.5%
Immigrants from Spain
0.0
/100
|
#297
Tragic
50.4%

Immigrants from Panama 2 or more Vehicles in Household Correlation Summary

MeasurementImmigrants from Panama Data2 or more Vehicles in Household Data
Minimum0.042%16.5%
Maximum26.3%100.0%
Range26.3%83.5%
Mean4.0%59.9%
Median2.4%58.8%
Interquartile 25% (IQ1)1.1%45.5%
Interquartile 75% (IQ3)4.2%75.3%
Interquartile Range (IQR)3.1%29.8%
Standard Deviation (Sample)5.4%17.2%
Standard Deviation (Population)5.4%16.9%

Correlation Details

Immigrants from Panama PercentileSample Size2 or more Vehicles in Household
[
0.0%
-
0.5%
]
0.042%
177,245,34055.3%
[
0.0%
-
0.5%
]
0.18%
30,554,26343.5%
[
0.0%
-
0.5%
]
0.32%
6,808,25854.5%
[
0.0%
-
0.5%
]
0.45%
3,119,55957.1%
[
0.5%
-
1.0%
]
0.59%
1,462,01242.0%
[
0.5%
-
1.0%
]
0.73%
910,31851.1%
[
0.5%
-
1.0%
]
0.85%
295,32844.7%
[
0.5%
-
1.0%
]
0.96%
255,19256.4%
[
1.0%
-
1.5%
]
1.10%
170,82838.0%
[
1.0%
-
1.5%
]
1.24%
167,23848.2%
[
1.0%
-
1.5%
]
1.36%
4,39651.4%
[
1.0%
-
1.5%
]
1.49%
34,22665.1%
[
1.5%
-
2.0%
]
1.66%
18,76552.4%
[
1.5%
-
2.0%
]
1.78%
37,50860.4%
[
1.5%
-
2.0%
]
1.90%
1,84165.1%
[
2.0%
-
2.5%
]
2.03%
24,41374.6%
[
2.0%
-
2.5%
]
2.17%
4,10565.9%
[
2.0%
-
2.5%
]
2.36%
19,21676.2%
[
2.0%
-
2.5%
]
2.47%
1,46066.6%
[
2.5%
-
3.0%
]
2.57%
3,77541.6%
[
2.5%
-
3.0%
]
2.84%
1,65375.1%
[
2.5%
-
3.0%
]
2.97%
1,24778.1%
[
3.0%
-
3.5%
]
3.11%
64479.6%
[
3.0%
-
3.5%
]
3.33%
7,29945.5%
[
3.0%
-
3.5%
]
3.45%
52276.9%
[
3.5%
-
4.0%
]
3.66%
2,18340.8%
[
4.0%
-
4.5%
]
4.19%
1,00276.2%
[
4.0%
-
4.5%
]
4.28%
1,33258.8%
[
4.0%
-
4.5%
]
4.37%
18375.3%
[
4.5%
-
5.0%
]
4.62%
1,38576.4%
[
7.5%
-
8.0%
]
7.59%
51473.2%
[
8.5%
-
9.0%
]
8.51%
4780.8%
[
14.5%
-
15.0%
]
14.61%
21933.6%
[
18.0%
-
18.5%
]
18.29%
17516.5%
[
26.0%
-
26.5%
]
26.32%
19100.0%