Immigrants from Nigeria 3 or more Vehicles in Household
COMPARE
Immigrants from Nigeria
Select to Compare
3 or more Vehicles in Household
Immigrants from Nigeria 3 or more Vehicles in Household
18.7%
3+ VEHICLES AVAILABLE
10.3/ 100
METRIC RATING
216th/ 347
METRIC RANK
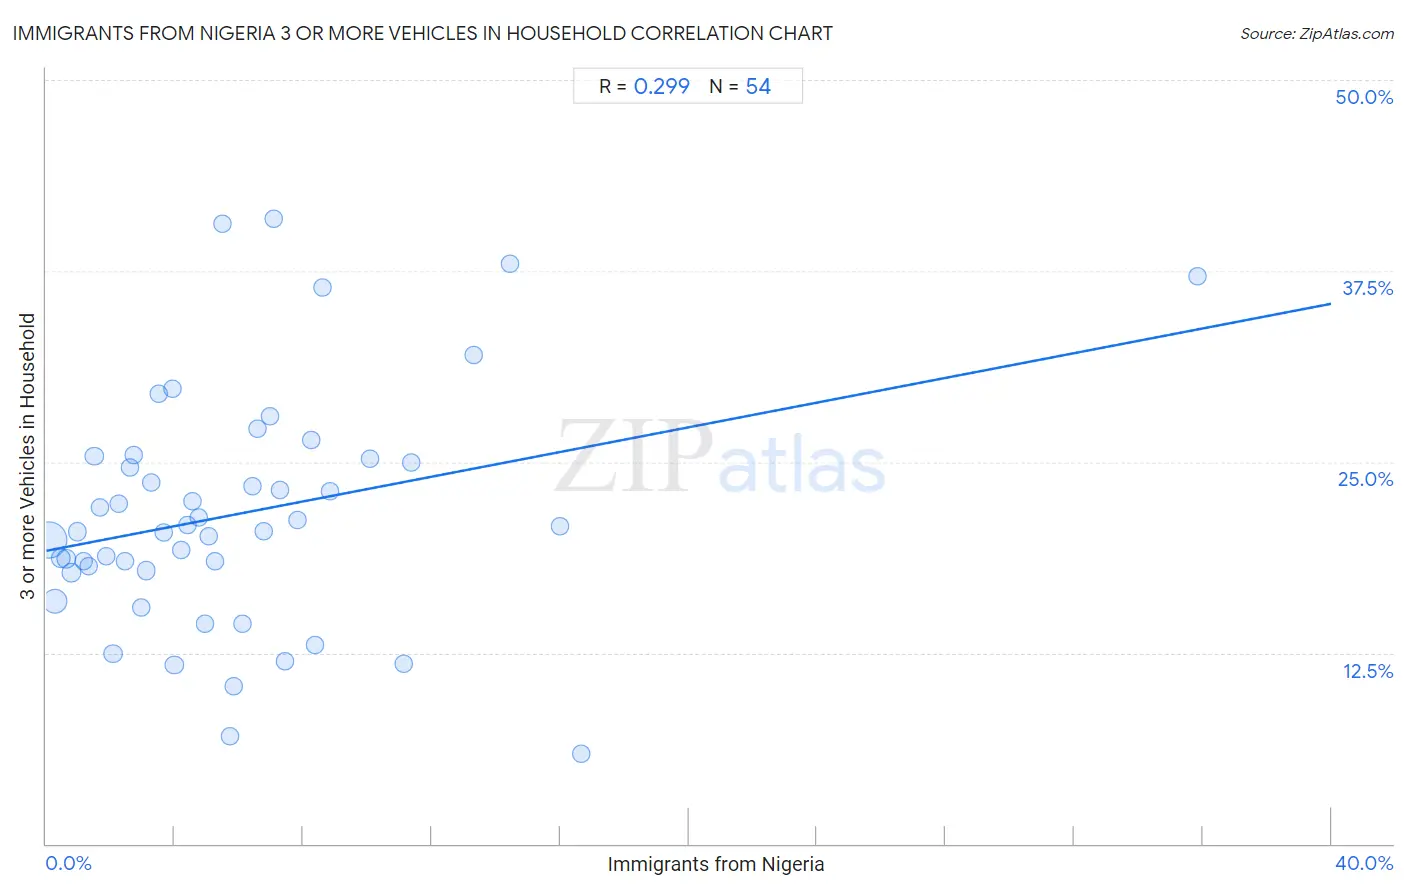
Immigrants from Nigeria 3 or more Vehicles in Household Correlation Chart
The statistical analysis conducted on geographies consisting of 283,187,528 people shows a weak positive correlation between the proportion of Immigrants from Nigeria and percentage of households with 3 or more vehicles available in the United States with a correlation coefficient (R) of 0.299 and weighted average of 18.7%. On average, for every 1% (one percent) increase in Immigrants from Nigeria within a typical geography, there is an increase of 0.40% in percentage of households with 3 or more vehicles available.
It is essential to understand that the correlation between the percentage of Immigrants from Nigeria and percentage of households with 3 or more vehicles available does not imply a direct cause-and-effect relationship. It remains uncertain whether the presence of Immigrants from Nigeria influences an upward or downward trend in the level of percentage of households with 3 or more vehicles available within an area, or if Immigrants from Nigeria simply ended up residing in those areas with higher or lower levels of percentage of households with 3 or more vehicles available due to other factors.
Demographics Similar to Immigrants from Nigeria by 3 or more Vehicles in Household
In terms of 3 or more vehicles in household, the demographic groups most similar to Immigrants from Nigeria are Immigrants from Italy (18.7%, a difference of 0.020%), Eastern European (18.7%, a difference of 0.060%), Immigrants from Sierra Leone (18.7%, a difference of 0.10%), Panamanian (18.8%, a difference of 0.26%), and Immigrants from Cuba (18.8%, a difference of 0.26%).
| Demographics | Rating | Rank | 3 or more Vehicles in Household |
| Immigrants from Egypt | 13.5 /100 | #209 | Poor 18.8% |
| Bulgarians | 13.1 /100 | #210 | Poor 18.8% |
| Immigrants from Kenya | 12.4 /100 | #211 | Poor 18.8% |
| Panamanians | 11.6 /100 | #212 | Poor 18.8% |
| Immigrants from Cuba | 11.6 /100 | #213 | Poor 18.8% |
| Immigrants from Sierra Leone | 10.8 /100 | #214 | Poor 18.7% |
| Eastern Europeans | 10.6 /100 | #215 | Poor 18.7% |
| Immigrants from Nigeria | 10.3 /100 | #216 | Poor 18.7% |
| Immigrants from Italy | 10.2 /100 | #217 | Poor 18.7% |
| Immigrants from Portugal | 8.9 /100 | #218 | Tragic 18.6% |
| Immigrants from Armenia | 8.6 /100 | #219 | Tragic 18.6% |
| Nigerians | 7.9 /100 | #220 | Tragic 18.6% |
| Immigrants from Poland | 7.5 /100 | #221 | Tragic 18.6% |
| Belizeans | 7.3 /100 | #222 | Tragic 18.6% |
| Immigrants from Czechoslovakia | 5.9 /100 | #223 | Tragic 18.5% |
Immigrants from Nigeria 3 or more Vehicles in Household Correlation Summary
| Measurement | Immigrants from Nigeria Data | 3 or more Vehicles in Household Data |
| Minimum | 0.073% | 5.9% |
| Maximum | 35.8% | 40.9% |
| Range | 35.7% | 35.0% |
| Mean | 6.0% | 21.6% |
| Median | 4.8% | 20.6% |
| Interquartile 25% (IQ1) | 2.4% | 17.9% |
| Interquartile 75% (IQ3) | 7.4% | 25.2% |
| Interquartile Range (IQR) | 5.0% | 7.3% |
| Standard Deviation (Sample) | 5.7% | 7.8% |
| Standard Deviation (Population) | 5.7% | 7.7% |
Correlation Details
| Immigrants from Nigeria Percentile | Sample Size | 3 or more Vehicles in Household |
[ 0.0% - 0.5% ] 0.073% | 172,521,961 | 19.9% |
[ 0.0% - 0.5% ] 0.26% | 57,787,358 | 15.9% |
[ 0.0% - 0.5% ] 0.45% | 20,696,128 | 18.7% |
[ 0.5% - 1.0% ] 0.62% | 10,479,017 | 18.7% |
[ 0.5% - 1.0% ] 0.80% | 8,624,998 | 17.7% |
[ 0.5% - 1.0% ] 0.97% | 3,084,182 | 20.4% |
[ 1.0% - 1.5% ] 1.17% | 1,754,555 | 18.5% |
[ 1.0% - 1.5% ] 1.33% | 1,524,807 | 18.2% |
[ 1.0% - 1.5% ] 1.50% | 1,119,593 | 25.4% |
[ 1.5% - 2.0% ] 1.68% | 1,007,547 | 22.1% |
[ 1.5% - 2.0% ] 1.87% | 458,980 | 18.8% |
[ 2.0% - 2.5% ] 2.08% | 911,168 | 12.4% |
[ 2.0% - 2.5% ] 2.25% | 386,234 | 22.3% |
[ 2.0% - 2.5% ] 2.44% | 369,314 | 18.5% |
[ 2.5% - 3.0% ] 2.61% | 203,427 | 24.7% |
[ 2.5% - 3.0% ] 2.72% | 18,803 | 25.5% |
[ 2.5% - 3.0% ] 2.94% | 224,822 | 15.5% |
[ 3.0% - 3.5% ] 3.12% | 240,487 | 17.9% |
[ 3.0% - 3.5% ] 3.26% | 184,632 | 23.6% |
[ 3.0% - 3.5% ] 3.50% | 151,060 | 29.5% |
[ 3.5% - 4.0% ] 3.65% | 287,893 | 20.4% |
[ 3.5% - 4.0% ] 3.92% | 20,688 | 29.8% |
[ 3.5% - 4.0% ] 3.99% | 181,679 | 11.7% |
[ 4.0% - 4.5% ] 4.19% | 113,203 | 19.2% |
[ 4.0% - 4.5% ] 4.40% | 56,437 | 20.9% |
[ 4.5% - 5.0% ] 4.55% | 79,530 | 22.4% |
[ 4.5% - 5.0% ] 4.76% | 102,259 | 21.4% |
[ 4.5% - 5.0% ] 4.93% | 16,429 | 14.4% |
[ 5.0% - 5.5% ] 5.05% | 28,565 | 20.1% |
[ 5.0% - 5.5% ] 5.25% | 79,506 | 18.5% |
[ 5.0% - 5.5% ] 5.49% | 19,619 | 40.6% |
[ 5.5% - 6.0% ] 5.70% | 9,781 | 7.1% |
[ 5.5% - 6.0% ] 5.83% | 62,975 | 10.3% |
[ 6.0% - 6.5% ] 6.10% | 30,335 | 14.4% |
[ 6.0% - 6.5% ] 6.41% | 15,405 | 23.4% |
[ 6.5% - 7.0% ] 6.58% | 106,517 | 27.2% |
[ 6.5% - 7.0% ] 6.77% | 32,191 | 20.5% |
[ 6.5% - 7.0% ] 6.98% | 387 | 28.0% |
[ 7.0% - 7.5% ] 7.10% | 310 | 40.9% |
[ 7.0% - 7.5% ] 7.29% | 1,934 | 23.2% |
[ 7.0% - 7.5% ] 7.41% | 526 | 11.9% |
[ 7.5% - 8.0% ] 7.83% | 49,541 | 21.2% |
[ 8.0% - 8.5% ] 8.23% | 76,600 | 26.5% |
[ 8.0% - 8.5% ] 8.38% | 40,125 | 13.0% |
[ 8.5% - 9.0% ] 8.61% | 11,504 | 36.4% |
[ 8.5% - 9.0% ] 8.84% | 5,331 | 23.1% |
[ 10.0% - 10.5% ] 10.08% | 1,875 | 25.2% |
[ 11.0% - 11.5% ] 11.11% | 468 | 11.8% |
[ 11.0% - 11.5% ] 11.36% | 44 | 25.0% |
[ 13.0% - 13.5% ] 13.30% | 421 | 32.0% |
[ 14.0% - 14.5% ] 14.44% | 2,348 | 38.0% |
[ 15.5% - 16.0% ] 15.99% | 3,914 | 20.8% |
[ 16.5% - 17.0% ] 16.67% | 48 | 5.9% |
[ 35.5% - 36.0% ] 35.82% | 67 | 37.1% |