Immigrants from Nigeria Wage/Income Gap

COMPARE

Immigrants from Nigeria
Race
Ancestry
AfghanAfricanAlaska NativeAlaskan AthabascanAlbanianAleutAlsatianAmericanApacheArabArapahoArgentineanArmenianAssyrian/Chaldean/SyriacAustralianAustrianBahamianBangladeshiBarbadianBasqueBelgianBelizeanBermudanBhutaneseBlackfeetBolivianBrazilianBritishBritish West IndianBulgarianBurmeseCajunCambodianCanadianCape VerdeanCarpatho RusynCelticCentral AmericanCentral American IndianCherokeeCheyenneChickasawChileanChineseChippewaChoctawColombianColvilleComancheCosta RicanCreeCreekCroatianCrowCubanCypriotCzechCzechoslovakianDanishDelawareDominicanDutchDutch West IndianEastern EuropeanEcuadorianEgyptianEnglishEstonianEthiopianEuropeanFijianFilipinoFinnishFrenchFrench American IndianFrench CanadianGermanGerman RussianGhanaianGreekGuamanian/ChamorroGuatemalanGuyaneseHaitianHmongHonduranHopiHoumaHungarianIcelanderIndian (Asian)IndonesianInupiatIranianIraqiIrishIroquoisIsraeliItalianJamaicanJapaneseJordanianKenyanKiowaKoreanLaotianLatvianLebaneseLiberianLithuanianLumbeeLuxembourgerMacedonianMalaysianMalteseMarshalleseMenomineeMexicanMexican American IndianMongolianMoroccanNative HawaiianNavajoNepaleseNew ZealanderNicaraguanNigerianNorthern EuropeanNorwegianOkinawanOsageOttawaPaiutePakistaniPalestinianPanamanianParaguayanPennsylvania GermanPeruvianPimaPolishPortuguesePotawatomiPuebloPuerto RicanPuget Sound SalishRomanianRussianSalvadoranSamoanScandinavianScotch-IrishScottishSeminoleSenegaleseSerbianShoshoneSierra LeoneanSiouxSlavicSlovakSloveneSomaliSouth AfricanSouth AmericanSouth American IndianSoviet UnionSpaniardSpanishSpanish AmericanSpanish American IndianSri LankanSubsaharan AfricanSudaneseSwedishSwissSyrianTaiwaneseThaiTlingit-HaidaTohono O'OdhamTonganTrinidadian and TobagonianTsimshianTurkishU.S. Virgin IslanderUgandanUkrainianUruguayanUteVenezuelanVietnameseWelshWest IndianYakamaYaquiYugoslavianYumanYup'ikZimbabwean
Immigration
NonimmigrantsImmigrantsAfghanistanAfricaAlbaniaArgentinaArmeniaAsiaAustraliaAustriaBahamasBangladeshBarbadosBelarusBelgiumBelizeBoliviaBosnia and HerzegovinaBrazilBulgariaBurma/MyanmarCabo VerdeCambodiaCameroonCanadaCaribbeanCentral AmericaChileChinaColombiaCongoCosta RicaCroatiaCubaCzechoslovakiaDenmarkDominicaDominican RepublicEastern AfricaEastern AsiaEastern EuropeEcuadorEgyptEl SalvadorEnglandEritreaEthiopiaEuropeFijiFranceGermanyGhanaGreeceGrenadaGuatemalaGuyanaHaitiHondurasHong KongHungaryIndiaIndonesiaIranIraqIrelandIsraelItalyJamaicaJapanJordanKazakhstanKenyaKoreaKuwaitLaosLatin AmericaLatviaLebanonLiberiaLithuaniaMalaysiaMexicoMicronesiaMiddle AfricaMoldovaMoroccoNepalNetherlandsNicaraguaNigeriaNorth AmericaNorth MacedoniaNorthern AfricaNorthern EuropeNorwayOceaniaPakistanPanamaPeruPhilippinesPolandPortugalRomaniaRussiaSaudi ArabiaScotlandSenegalSerbiaSierra LeoneSingaporeSomaliaSouth AfricaSouth AmericaSouth Central AsiaSouth Eastern AsiaSouthern EuropeSpainSri LankaSt. Vincent and the GrenadinesSudanSwedenSwitzerlandSyriaTaiwanThailandTrinidad and TobagoTurkeyUgandaUkraineUruguayUzbekistanVenezuelaVietnamWest IndiesWestern AfricaWestern AsiaWestern EuropeYemenZaireZimbabweAzores
Select to Compare
Race
Ancestry
AfghanAfricanAlaska NativeAlaskan AthabascanAlbanianAleutAlsatianAmericanApacheArabArapahoArgentineanArmenianAssyrian/Chaldean/SyriacAustralianAustrianBahamianBangladeshiBarbadianBasqueBelgianBelizeanBermudanBhutaneseBlackfeetBolivianBrazilianBritishBritish West IndianBulgarianBurmeseCajunCambodianCanadianCape VerdeanCarpatho RusynCelticCentral AmericanCentral American IndianCherokeeCheyenneChickasawChileanChineseChippewaChoctawColombianColvilleComancheCosta RicanCreeCreekCroatianCrowCubanCypriotCzechCzechoslovakianDanishDelawareDominicanDutchDutch West IndianEastern EuropeanEcuadorianEgyptianEnglishEstonianEthiopianEuropeanFijianFilipinoFinnishFrenchFrench American IndianFrench CanadianGermanGerman RussianGhanaianGreekGuamanian/ChamorroGuatemalanGuyaneseHaitianHmongHonduranHopiHoumaHungarianIcelanderIndian (Asian)IndonesianInupiatIranianIraqiIrishIroquoisIsraeliItalianJamaicanJapaneseJordanianKenyanKiowaKoreanLaotianLatvianLebaneseLiberianLithuanianLumbeeLuxembourgerMacedonianMalaysianMalteseMarshalleseMenomineeMexicanMexican American IndianMongolianMoroccanNative HawaiianNavajoNepaleseNew ZealanderNicaraguanNigerianNorthern EuropeanNorwegianOkinawanOsageOttawaPaiutePakistaniPalestinianPanamanianParaguayanPennsylvania GermanPeruvianPimaPolishPortuguesePotawatomiPuebloPuerto RicanPuget Sound SalishRomanianRussianSalvadoranSamoanScandinavianScotch-IrishScottishSeminoleSenegaleseSerbianShoshoneSierra LeoneanSiouxSlavicSlovakSloveneSomaliSouth AfricanSouth AmericanSouth American IndianSoviet UnionSpaniardSpanishSpanish AmericanSpanish American IndianSri LankanSubsaharan AfricanSudaneseSwedishSwissSyrianTaiwaneseThaiTlingit-HaidaTohono O'OdhamTonganTrinidadian and TobagonianTsimshianTurkishU.S. Virgin IslanderUgandanUkrainianUruguayanUteVenezuelanVietnameseWelshWest IndianYakamaYaquiYugoslavianYumanYup'ikZimbabwean
Immigration
NonimmigrantsImmigrantsAfghanistanAfricaAlbaniaArgentinaArmeniaAsiaAustraliaAustriaBahamasBangladeshBarbadosBelarusBelgiumBelizeBoliviaBosnia and HerzegovinaBrazilBulgariaBurma/MyanmarCabo VerdeCambodiaCameroonCanadaCaribbeanCentral AmericaChileChinaColombiaCongoCosta RicaCroatiaCubaCzechoslovakiaDenmarkDominicaDominican RepublicEastern AfricaEastern AsiaEastern EuropeEcuadorEgyptEl SalvadorEnglandEritreaEthiopiaEuropeFijiFranceGermanyGhanaGreeceGrenadaGuatemalaGuyanaHaitiHondurasHong KongHungaryIndiaIndonesiaIranIraqIrelandIsraelItalyJamaicaJapanJordanKazakhstanKenyaKoreaKuwaitLaosLatin AmericaLatviaLebanonLiberiaLithuaniaMalaysiaMexicoMicronesiaMiddle AfricaMoldovaMoroccoNepalNetherlandsNicaraguaNorth AmericaNorth MacedoniaNorthern AfricaNorthern EuropeNorwayOceaniaPakistanPanamaPeruPhilippinesPolandPortugalRomaniaRussiaSaudi ArabiaScotlandSenegalSerbiaSierra LeoneSingaporeSomaliaSouth AfricaSouth AmericaSouth Central AsiaSouth Eastern AsiaSouthern EuropeSpainSri LankaSt. Vincent and the GrenadinesSudanSwedenSwitzerlandSyriaTaiwanThailandTrinidad and TobagoTurkeyUgandaUkraineUruguayUzbekistanVenezuelaVietnamWest IndiesWestern AfricaWestern AsiaWestern EuropeYemenZaireZimbabweAzores
Wage/Income Gap
Income
Poverty
Unemployment
Labor Participation
Family Structure
Vehicle Availability
Education Level
Disability

Immigrants from Nigeria Wage/Income Gap
Exceptional

22.7%
WAGE/INCOME GAP
99.9/ 100
METRIC RATING
68th/ 347
METRIC RANK

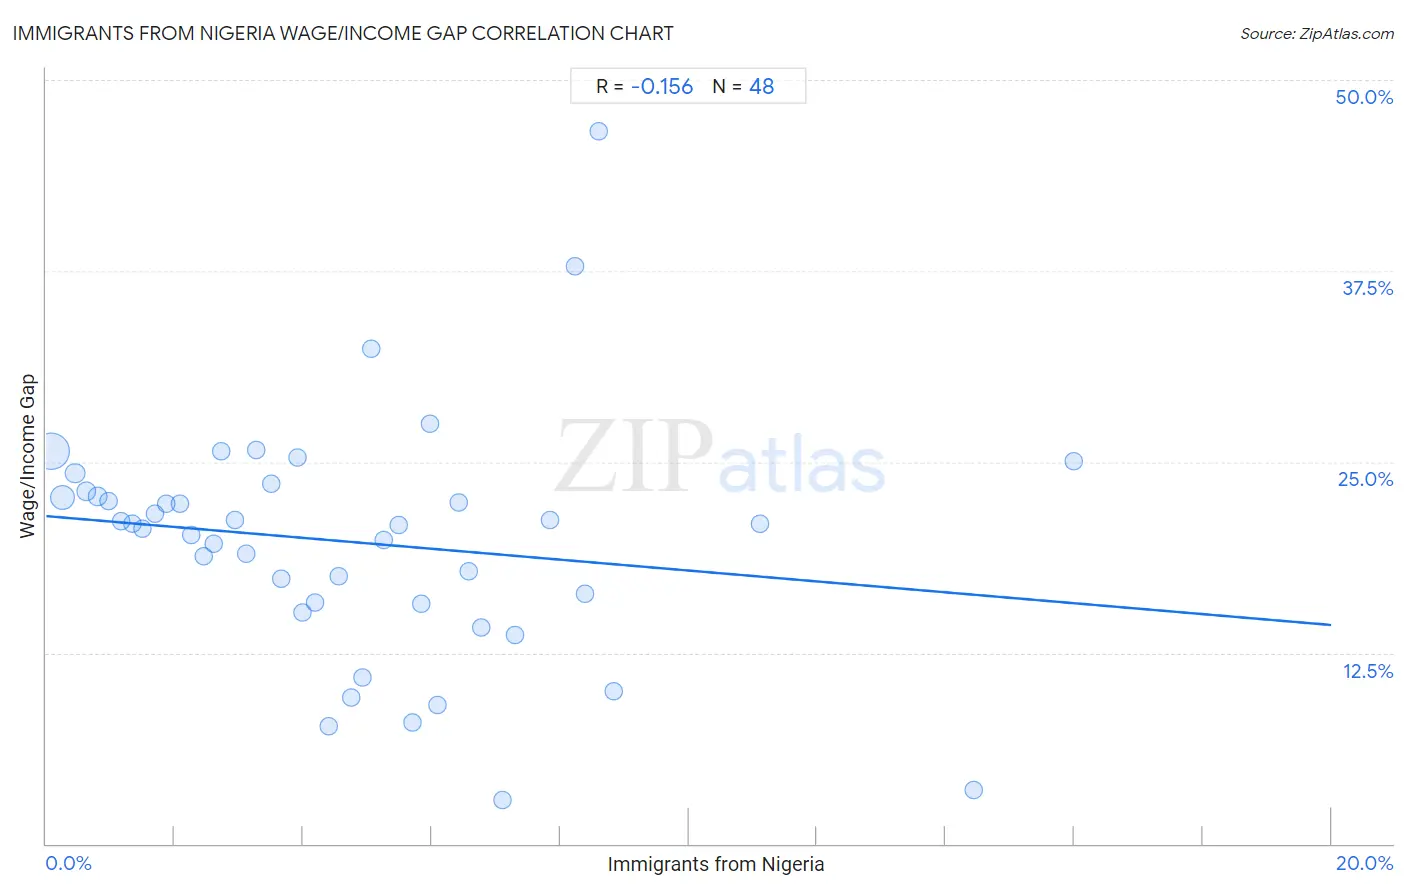
Immigrants from Nigeria Wage/Income Gap Correlation Chart

The statistical analysis conducted on geographies consisting of 283,442,522 people shows a poor negative correlation between the proportion of Immigrants from Nigeria and wage/income gap percentage in the United States with a correlation coefficient (R) of -0.156 and weighted average of 22.7%. On average, for every 1% (one percent) increase in Immigrants from Nigeria within a typical geography, there is a decrease of 0.36% in wage/income gap percentage.
Immigrants from Nigeria Wage/Income Gap
It is essential to understand that the correlation between the percentage of Immigrants from Nigeria and wage/income gap percentage does not imply a direct cause-and-effect relationship. It remains uncertain whether the presence of Immigrants from Nigeria influences an upward or downward trend in the level of wage/income gap percentage within an area, or if Immigrants from Nigeria simply ended up residing in those areas with higher or lower levels of wage/income gap percentage due to other factors.

Demographics Similar to Immigrants from Nigeria by Wage/Income Gap

In terms of wage/income gap, the demographic groups most similar to Immigrants from Nigeria are Menominee (22.7%, a difference of 0.0%), Indonesian (22.7%, a difference of 0.030%), Immigrants from Uzbekistan (22.7%, a difference of 0.14%), Central American Indian (22.7%, a difference of 0.18%), and Immigrants from El Salvador (22.8%, a difference of 0.31%).
DemographicsRating | RankWage/Income Gap
Immigrants from Fiji
100.0
/100
|
#61
Exceptional
22.4%
Immigrants from Guatemala
100.0
/100
|
#62
Exceptional
22.5%
Immigrants from Ecuador
100.0
/100
|
#63
Exceptional
22.5%
Spanish American Indians
100.0
/100
|
#64
Exceptional
22.5%
Guatemalans
99.9
/100
|
#65
Exceptional
22.6%
Central American Indians
99.9
/100
|
#66
Exceptional
22.7%
Menominee
99.9
/100
|
#67
Exceptional
22.7%
Immigrants from Nigeria
99.9
/100
|
#68
Exceptional
22.7%
Indonesians
99.9
/100
|
#69
Exceptional
22.7%
Immigrants from Uzbekistan
99.9
/100
|
#70
Exceptional
22.7%
Immigrants from El Salvador
99.9
/100
|
#71
Exceptional
22.8%
Sub-Saharan Africans
99.9
/100
|
#72
Exceptional
22.8%
Immigrants from Eastern Africa
99.9
/100
|
#73
Exceptional
22.8%
Immigrants from Burma/Myanmar
99.9
/100
|
#74
Exceptional
22.8%
Fijians
99.9
/100
|
#75
Exceptional
22.9%

Immigrants from Nigeria Wage/Income Gap Correlation Summary

MeasurementImmigrants from Nigeria DataWage/Income Gap Data
Minimum0.073%2.9%
Maximum16.0%46.7%
Range15.9%43.8%
Mean4.7%19.8%
Median4.3%20.9%
Interquartile 25% (IQ1)2.2%15.8%
Interquartile 75% (IQ3)6.5%22.9%
Interquartile Range (IQR)4.3%7.2%
Standard Deviation (Sample)3.4%7.9%
Standard Deviation (Population)3.4%7.8%

Correlation Details

Immigrants from Nigeria PercentileSample SizeWage/Income Gap
[
0.0%
-
0.5%
]
0.073%
172,604,93025.7%
[
0.0%
-
0.5%
]
0.26%
57,856,11222.6%
[
0.0%
-
0.5%
]
0.45%
20,762,30524.2%
[
0.5%
-
1.0%
]
0.62%
10,497,20823.1%
[
0.5%
-
1.0%
]
0.80%
8,626,54922.8%
[
0.5%
-
1.0%
]
0.97%
3,088,62122.4%
[
1.0%
-
1.5%
]
1.17%
1,756,74721.1%
[
1.0%
-
1.5%
]
1.33%
1,529,15520.9%
[
1.0%
-
1.5%
]
1.50%
1,123,32320.6%
[
1.5%
-
2.0%
]
1.68%
1,006,53721.6%
[
1.5%
-
2.0%
]
1.87%
457,79322.2%
[
2.0%
-
2.5%
]
2.08%
911,56922.3%
[
2.0%
-
2.5%
]
2.25%
388,38820.2%
[
2.0%
-
2.5%
]
2.44%
369,31418.8%
[
2.5%
-
3.0%
]
2.61%
203,42719.6%
[
2.5%
-
3.0%
]
2.73%
17,68825.7%
[
2.5%
-
3.0%
]
2.94%
225,53521.2%
[
3.0%
-
3.5%
]
3.12%
240,48719.0%
[
3.0%
-
3.5%
]
3.26%
185,94025.8%
[
3.0%
-
3.5%
]
3.50%
151,06023.5%
[
3.5%
-
4.0%
]
3.65%
292,42117.4%
[
3.5%
-
4.0%
]
3.92%
20,68825.3%
[
3.5%
-
4.0%
]
3.99%
180,74315.2%
[
4.0%
-
4.5%
]
4.19%
112,94615.8%
[
4.0%
-
4.5%
]
4.40%
56,4377.7%
[
4.5%
-
5.0%
]
4.55%
79,53017.5%
[
4.5%
-
5.0%
]
4.76%
102,0919.6%
[
4.5%
-
5.0%
]
4.93%
16,42910.9%
[
5.0%
-
5.5%
]
5.05%
28,56532.4%
[
5.0%
-
5.5%
]
5.25%
79,50619.9%
[
5.0%
-
5.5%
]
5.49%
19,61920.9%
[
5.5%
-
6.0%
]
5.70%
10,2907.9%
[
5.5%
-
6.0%
]
5.83%
62,97515.7%
[
5.5%
-
6.0%
]
5.98%
1,07127.5%
[
6.0%
-
6.5%
]
6.10%
30,3359.1%
[
6.0%
-
6.5%
]
6.41%
15,40522.3%
[
6.5%
-
7.0%
]
6.58%
106,51717.9%
[
6.5%
-
7.0%
]
6.77%
32,19114.2%
[
7.0%
-
7.5%
]
7.10%
3102.9%
[
7.0%
-
7.5%
]
7.29%
1,93413.7%
[
7.5%
-
8.0%
]
7.83%
49,54121.2%
[
8.0%
-
8.5%
]
8.23%
76,60037.8%
[
8.0%
-
8.5%
]
8.38%
40,12516.4%
[
8.5%
-
9.0%
]
8.61%
11,50446.7%
[
8.5%
-
9.0%
]
8.84%
5,33110.0%
[
11.0%
-
11.5%
]
11.11%
46820.9%
[
14.0%
-
14.5%
]
14.44%
2,3483.6%
[
15.5%
-
16.0%
]
15.99%
3,91425.1%