Immigrants from Nigeria Disability

COMPARE

Immigrants from Nigeria
Race
Ancestry
AfghanAfricanAlaska NativeAlaskan AthabascanAlbanianAleutAlsatianAmericanApacheArabArapahoArgentineanArmenianAssyrian/Chaldean/SyriacAustralianAustrianBahamianBangladeshiBarbadianBasqueBelgianBelizeanBermudanBhutaneseBlackfeetBolivianBrazilianBritishBritish West IndianBulgarianBurmeseCajunCambodianCanadianCape VerdeanCarpatho RusynCelticCentral AmericanCentral American IndianCherokeeCheyenneChickasawChileanChineseChippewaChoctawColombianColvilleComancheCosta RicanCreeCreekCroatianCrowCubanCypriotCzechCzechoslovakianDanishDelawareDominicanDutchDutch West IndianEastern EuropeanEcuadorianEgyptianEnglishEstonianEthiopianEuropeanFijianFilipinoFinnishFrenchFrench American IndianFrench CanadianGermanGerman RussianGhanaianGreekGuamanian/ChamorroGuatemalanGuyaneseHaitianHmongHonduranHopiHoumaHungarianIcelanderIndian (Asian)IndonesianInupiatIranianIraqiIrishIroquoisIsraeliItalianJamaicanJapaneseJordanianKenyanKiowaKoreanLaotianLatvianLebaneseLiberianLithuanianLumbeeLuxembourgerMacedonianMalaysianMalteseMarshalleseMenomineeMexicanMexican American IndianMongolianMoroccanNative HawaiianNavajoNepaleseNew ZealanderNicaraguanNigerianNorthern EuropeanNorwegianOkinawanOsageOttawaPaiutePakistaniPalestinianPanamanianParaguayanPennsylvania GermanPeruvianPimaPolishPortuguesePotawatomiPuebloPuerto RicanPuget Sound SalishRomanianRussianSalvadoranSamoanScandinavianScotch-IrishScottishSeminoleSenegaleseSerbianShoshoneSierra LeoneanSiouxSlavicSlovakSloveneSomaliSouth AfricanSouth AmericanSouth American IndianSoviet UnionSpaniardSpanishSpanish AmericanSpanish American IndianSri LankanSubsaharan AfricanSudaneseSwedishSwissSyrianTaiwaneseThaiTlingit-HaidaTohono O'OdhamTonganTrinidadian and TobagonianTsimshianTurkishU.S. Virgin IslanderUgandanUkrainianUruguayanUteVenezuelanVietnameseWelshWest IndianYakamaYaquiYugoslavianYumanYup'ikZimbabwean
Immigration
NonimmigrantsImmigrantsAfghanistanAfricaAlbaniaArgentinaArmeniaAsiaAustraliaAustriaBahamasBangladeshBarbadosBelarusBelgiumBelizeBoliviaBosnia and HerzegovinaBrazilBulgariaBurma/MyanmarCabo VerdeCambodiaCameroonCanadaCaribbeanCentral AmericaChileChinaColombiaCongoCosta RicaCroatiaCubaCzechoslovakiaDenmarkDominicaDominican RepublicEastern AfricaEastern AsiaEastern EuropeEcuadorEgyptEl SalvadorEnglandEritreaEthiopiaEuropeFijiFranceGermanyGhanaGreeceGrenadaGuatemalaGuyanaHaitiHondurasHong KongHungaryIndiaIndonesiaIranIraqIrelandIsraelItalyJamaicaJapanJordanKazakhstanKenyaKoreaKuwaitLaosLatin AmericaLatviaLebanonLiberiaLithuaniaMalaysiaMexicoMicronesiaMiddle AfricaMoldovaMoroccoNepalNetherlandsNicaraguaNigeriaNorth AmericaNorth MacedoniaNorthern AfricaNorthern EuropeNorwayOceaniaPakistanPanamaPeruPhilippinesPolandPortugalRomaniaRussiaSaudi ArabiaScotlandSenegalSerbiaSierra LeoneSingaporeSomaliaSouth AfricaSouth AmericaSouth Central AsiaSouth Eastern AsiaSouthern EuropeSpainSri LankaSt. Vincent and the GrenadinesSudanSwedenSwitzerlandSyriaTaiwanThailandTrinidad and TobagoTurkeyUgandaUkraineUruguayUzbekistanVenezuelaVietnamWest IndiesWestern AfricaWestern AsiaWestern EuropeYemenZaireZimbabweAzores
Select to Compare
Race
Ancestry
AfghanAfricanAlaska NativeAlaskan AthabascanAlbanianAleutAlsatianAmericanApacheArabArapahoArgentineanArmenianAssyrian/Chaldean/SyriacAustralianAustrianBahamianBangladeshiBarbadianBasqueBelgianBelizeanBermudanBhutaneseBlackfeetBolivianBrazilianBritishBritish West IndianBulgarianBurmeseCajunCambodianCanadianCape VerdeanCarpatho RusynCelticCentral AmericanCentral American IndianCherokeeCheyenneChickasawChileanChineseChippewaChoctawColombianColvilleComancheCosta RicanCreeCreekCroatianCrowCubanCypriotCzechCzechoslovakianDanishDelawareDominicanDutchDutch West IndianEastern EuropeanEcuadorianEgyptianEnglishEstonianEthiopianEuropeanFijianFilipinoFinnishFrenchFrench American IndianFrench CanadianGermanGerman RussianGhanaianGreekGuamanian/ChamorroGuatemalanGuyaneseHaitianHmongHonduranHopiHoumaHungarianIcelanderIndian (Asian)IndonesianInupiatIranianIraqiIrishIroquoisIsraeliItalianJamaicanJapaneseJordanianKenyanKiowaKoreanLaotianLatvianLebaneseLiberianLithuanianLumbeeLuxembourgerMacedonianMalaysianMalteseMarshalleseMenomineeMexicanMexican American IndianMongolianMoroccanNative HawaiianNavajoNepaleseNew ZealanderNicaraguanNigerianNorthern EuropeanNorwegianOkinawanOsageOttawaPaiutePakistaniPalestinianPanamanianParaguayanPennsylvania GermanPeruvianPimaPolishPortuguesePotawatomiPuebloPuerto RicanPuget Sound SalishRomanianRussianSalvadoranSamoanScandinavianScotch-IrishScottishSeminoleSenegaleseSerbianShoshoneSierra LeoneanSiouxSlavicSlovakSloveneSomaliSouth AfricanSouth AmericanSouth American IndianSoviet UnionSpaniardSpanishSpanish AmericanSpanish American IndianSri LankanSubsaharan AfricanSudaneseSwedishSwissSyrianTaiwaneseThaiTlingit-HaidaTohono O'OdhamTonganTrinidadian and TobagonianTsimshianTurkishU.S. Virgin IslanderUgandanUkrainianUruguayanUteVenezuelanVietnameseWelshWest IndianYakamaYaquiYugoslavianYumanYup'ikZimbabwean
Immigration
NonimmigrantsImmigrantsAfghanistanAfricaAlbaniaArgentinaArmeniaAsiaAustraliaAustriaBahamasBangladeshBarbadosBelarusBelgiumBelizeBoliviaBosnia and HerzegovinaBrazilBulgariaBurma/MyanmarCabo VerdeCambodiaCameroonCanadaCaribbeanCentral AmericaChileChinaColombiaCongoCosta RicaCroatiaCubaCzechoslovakiaDenmarkDominicaDominican RepublicEastern AfricaEastern AsiaEastern EuropeEcuadorEgyptEl SalvadorEnglandEritreaEthiopiaEuropeFijiFranceGermanyGhanaGreeceGrenadaGuatemalaGuyanaHaitiHondurasHong KongHungaryIndiaIndonesiaIranIraqIrelandIsraelItalyJamaicaJapanJordanKazakhstanKenyaKoreaKuwaitLaosLatin AmericaLatviaLebanonLiberiaLithuaniaMalaysiaMexicoMicronesiaMiddle AfricaMoldovaMoroccoNepalNetherlandsNicaraguaNorth AmericaNorth MacedoniaNorthern AfricaNorthern EuropeNorwayOceaniaPakistanPanamaPeruPhilippinesPolandPortugalRomaniaRussiaSaudi ArabiaScotlandSenegalSerbiaSierra LeoneSingaporeSomaliaSouth AfricaSouth AmericaSouth Central AsiaSouth Eastern AsiaSouthern EuropeSpainSri LankaSt. Vincent and the GrenadinesSudanSwedenSwitzerlandSyriaTaiwanThailandTrinidad and TobagoTurkeyUgandaUkraineUruguayUzbekistanVenezuelaVietnamWest IndiesWestern AfricaWestern AsiaWestern EuropeYemenZaireZimbabweAzores
Disability
Income
Poverty
Unemployment
Labor Participation
Family Structure
Vehicle Availability
Education Level
Disability

Immigrants from Nigeria Disability
Exceptional

11.3%
DISABILITY
96.0/ 100
METRIC RATING
108th/ 347
METRIC RANK

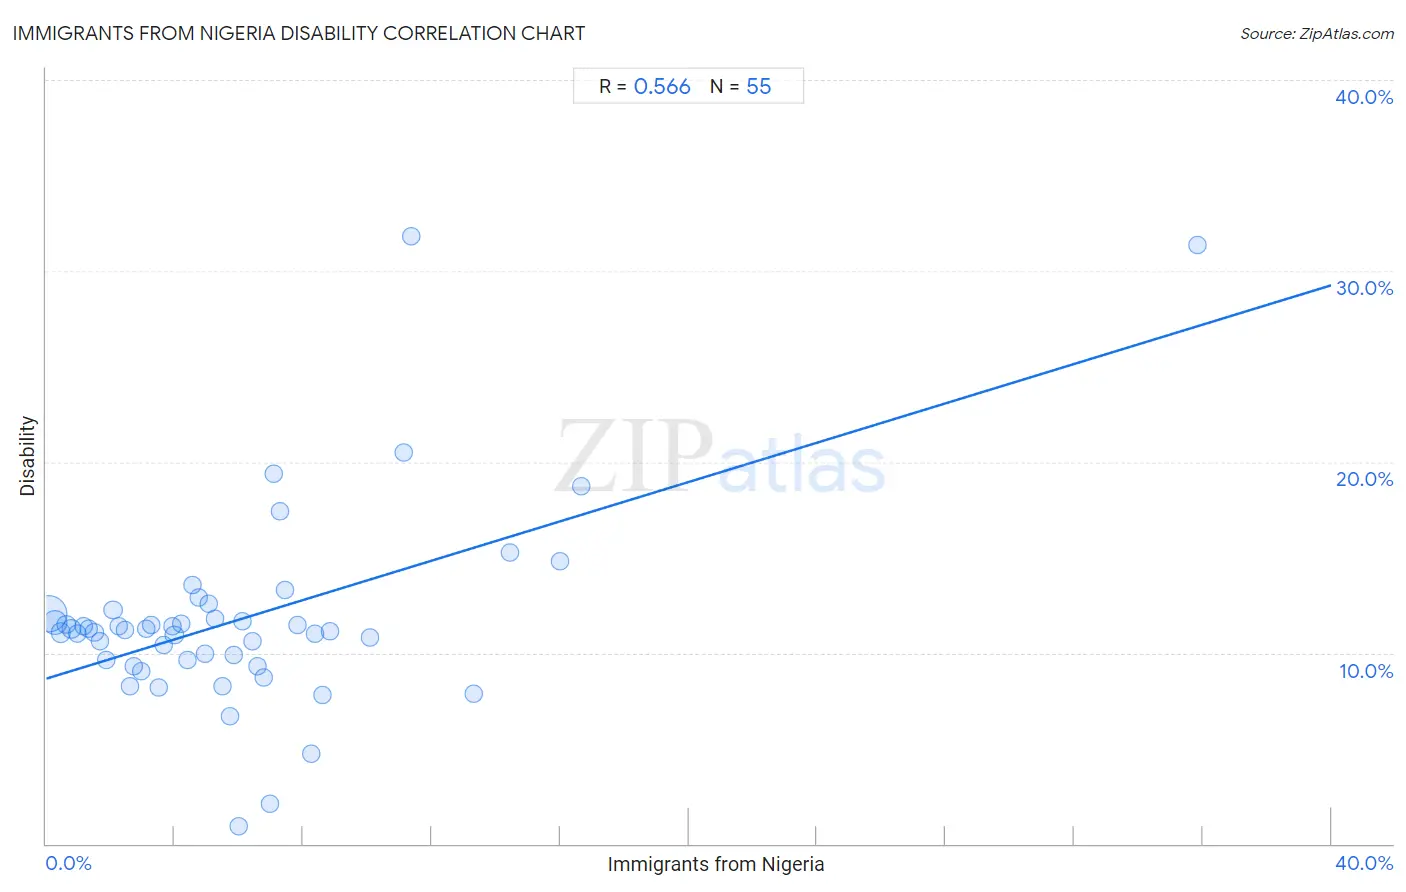
Immigrants from Nigeria Disability Correlation Chart

The statistical analysis conducted on geographies consisting of 283,478,180 people shows a substantial positive correlation between the proportion of Immigrants from Nigeria and percentage of population with a disability in the United States with a correlation coefficient (R) of 0.566 and weighted average of 11.3%. On average, for every 1% (one percent) increase in Immigrants from Nigeria within a typical geography, there is an increase of 0.52% in percentage of population with a disability.
Immigrants from Nigeria Disability
It is essential to understand that the correlation between the percentage of Immigrants from Nigeria and percentage of population with a disability does not imply a direct cause-and-effect relationship. It remains uncertain whether the presence of Immigrants from Nigeria influences an upward or downward trend in the level of percentage of population with a disability within an area, or if Immigrants from Nigeria simply ended up residing in those areas with higher or lower levels of percentage of population with a disability due to other factors.

Demographics Similar to Immigrants from Nigeria by Disability

In terms of disability, the demographic groups most similar to Immigrants from Nigeria are Nicaraguan (11.3%, a difference of 0.080%), Immigrants from Uganda (11.3%, a difference of 0.080%), Immigrants from Eastern Europe (11.3%, a difference of 0.10%), Immigrants from Denmark (11.3%, a difference of 0.10%), and Immigrants from Kazakhstan (11.3%, a difference of 0.13%).
DemographicsRating | RankDisability
Immigrants from Nicaragua
96.8
/100
|
#101
Exceptional
11.3%
Immigrants from Eastern Africa
96.7
/100
|
#102
Exceptional
11.3%
Immigrants from Uruguay
96.4
/100
|
#103
Exceptional
11.3%
Immigrants
96.4
/100
|
#104
Exceptional
11.3%
Immigrants from Kazakhstan
96.4
/100
|
#105
Exceptional
11.3%
Immigrants from Eastern Europe
96.3
/100
|
#106
Exceptional
11.3%
Nicaraguans
96.2
/100
|
#107
Exceptional
11.3%
Immigrants from Nigeria
96.0
/100
|
#108
Exceptional
11.3%
Immigrants from Uganda
95.7
/100
|
#109
Exceptional
11.3%
Immigrants from Denmark
95.6
/100
|
#110
Exceptional
11.3%
Immigrants from South Eastern Asia
95.4
/100
|
#111
Exceptional
11.3%
Immigrants from Uzbekistan
94.9
/100
|
#112
Exceptional
11.3%
Guyanese
94.7
/100
|
#113
Exceptional
11.3%
Immigrants from Syria
94.7
/100
|
#114
Exceptional
11.3%
Immigrants from Philippines
94.6
/100
|
#115
Exceptional
11.3%

Immigrants from Nigeria Disability Correlation Summary

MeasurementImmigrants from Nigeria DataDisability Data
Minimum0.073%0.93%
Maximum35.8%31.8%
Range35.7%30.9%
Mean6.0%11.7%
Median4.9%11.2%
Interquartile 25% (IQ1)2.4%9.6%
Interquartile 75% (IQ3)7.4%12.0%
Interquartile Range (IQR)5.0%2.4%
Standard Deviation (Sample)5.7%5.2%
Standard Deviation (Population)5.6%5.1%

Correlation Details

Immigrants from Nigeria PercentileSample SizeDisability
[
0.0%
-
0.5%
]
0.073%
172,614,36912.0%
[
0.0%
-
0.5%
]
0.26%
57,859,51111.6%
[
0.0%
-
0.5%
]
0.45%
20,766,72811.1%
[
0.5%
-
1.0%
]
0.62%
10,500,75911.5%
[
0.5%
-
1.0%
]
0.80%
8,632,29911.2%
[
0.5%
-
1.0%
]
0.97%
3,088,62111.0%
[
1.0%
-
1.5%
]
1.17%
1,757,45011.4%
[
1.0%
-
1.5%
]
1.33%
1,526,10811.3%
[
1.0%
-
1.5%
]
1.50%
1,124,44211.1%
[
1.5%
-
2.0%
]
1.68%
1,007,54710.6%
[
1.5%
-
2.0%
]
1.87%
458,9809.7%
[
2.0%
-
2.5%
]
2.08%
912,11512.3%
[
2.0%
-
2.5%
]
2.25%
388,44711.4%
[
2.0%
-
2.5%
]
2.44%
369,31411.2%
[
2.5%
-
3.0%
]
2.61%
203,4278.3%
[
2.5%
-
3.0%
]
2.72%
18,8039.3%
[
2.5%
-
3.0%
]
2.94%
226,6009.0%
[
3.0%
-
3.5%
]
3.12%
240,48711.3%
[
3.0%
-
3.5%
]
3.26%
185,94011.5%
[
3.0%
-
3.5%
]
3.50%
151,0608.2%
[
3.5%
-
4.0%
]
3.65%
292,42110.4%
[
3.5%
-
4.0%
]
3.92%
20,68811.4%
[
3.5%
-
4.0%
]
3.99%
181,67910.9%
[
4.0%
-
4.5%
]
4.19%
113,20311.5%
[
4.0%
-
4.5%
]
4.40%
56,4379.6%
[
4.5%
-
5.0%
]
4.55%
79,53013.5%
[
4.5%
-
5.0%
]
4.76%
102,25912.9%
[
4.5%
-
5.0%
]
4.93%
16,4299.9%
[
5.0%
-
5.5%
]
5.05%
28,56512.6%
[
5.0%
-
5.5%
]
5.25%
79,50611.8%
[
5.0%
-
5.5%
]
5.49%
19,9338.2%
[
5.5%
-
6.0%
]
5.70%
10,2906.7%
[
5.5%
-
6.0%
]
5.83%
62,9759.9%
[
5.5%
-
6.0%
]
5.98%
1,0710.93%
[
6.0%
-
6.5%
]
6.10%
30,33511.6%
[
6.0%
-
6.5%
]
6.41%
15,40510.6%
[
6.5%
-
7.0%
]
6.58%
106,5179.3%
[
6.5%
-
7.0%
]
6.77%
32,1918.7%
[
6.5%
-
7.0%
]
6.98%
3872.1%
[
7.0%
-
7.5%
]
7.10%
31019.4%
[
7.0%
-
7.5%
]
7.29%
1,93417.4%
[
7.0%
-
7.5%
]
7.42%
82213.3%
[
7.5%
-
8.0%
]
7.83%
49,54111.4%
[
8.0%
-
8.5%
]
8.23%
76,6004.7%
[
8.0%
-
8.5%
]
8.38%
40,12511.0%
[
8.5%
-
9.0%
]
8.61%
11,5047.8%
[
8.5%
-
9.0%
]
8.84%
5,33111.1%
[
10.0%
-
10.5%
]
10.08%
1,87510.8%
[
11.0%
-
11.5%
]
11.11%
46820.5%
[
11.0%
-
11.5%
]
11.36%
4431.8%
[
13.0%
-
13.5%
]
13.30%
4217.8%
[
14.0%
-
14.5%
]
14.44%
2,34815.2%
[
15.5%
-
16.0%
]
15.99%
3,91414.8%
[
16.5%
-
17.0%
]
16.67%
4818.8%
[
35.5%
-
36.0%
]
35.82%
6731.3%