Immigrants from Fiji Self-Care Disability
COMPARE
Immigrants from Fiji
Select to Compare
Self-Care Disability
Immigrants from Fiji Self-Care Disability
2.8%
SELF-CARE DISABILITY
0.0/ 100
METRIC RATING
300th/ 347
METRIC RANK
Immigrants from Fiji Self-Care Disability Correlation Chart
The statistical analysis conducted on geographies consisting of 93,753,839 people shows a perfect positive correlation between the proportion of Immigrants from Fiji and percentage of population with self-care disability in the United States with a correlation coefficient (R) of 0.968 and weighted average of 2.8%. On average, for every 1% (one percent) increase in Immigrants from Fiji within a typical geography, there is an increase of 0.98% in percentage of population with self-care disability.
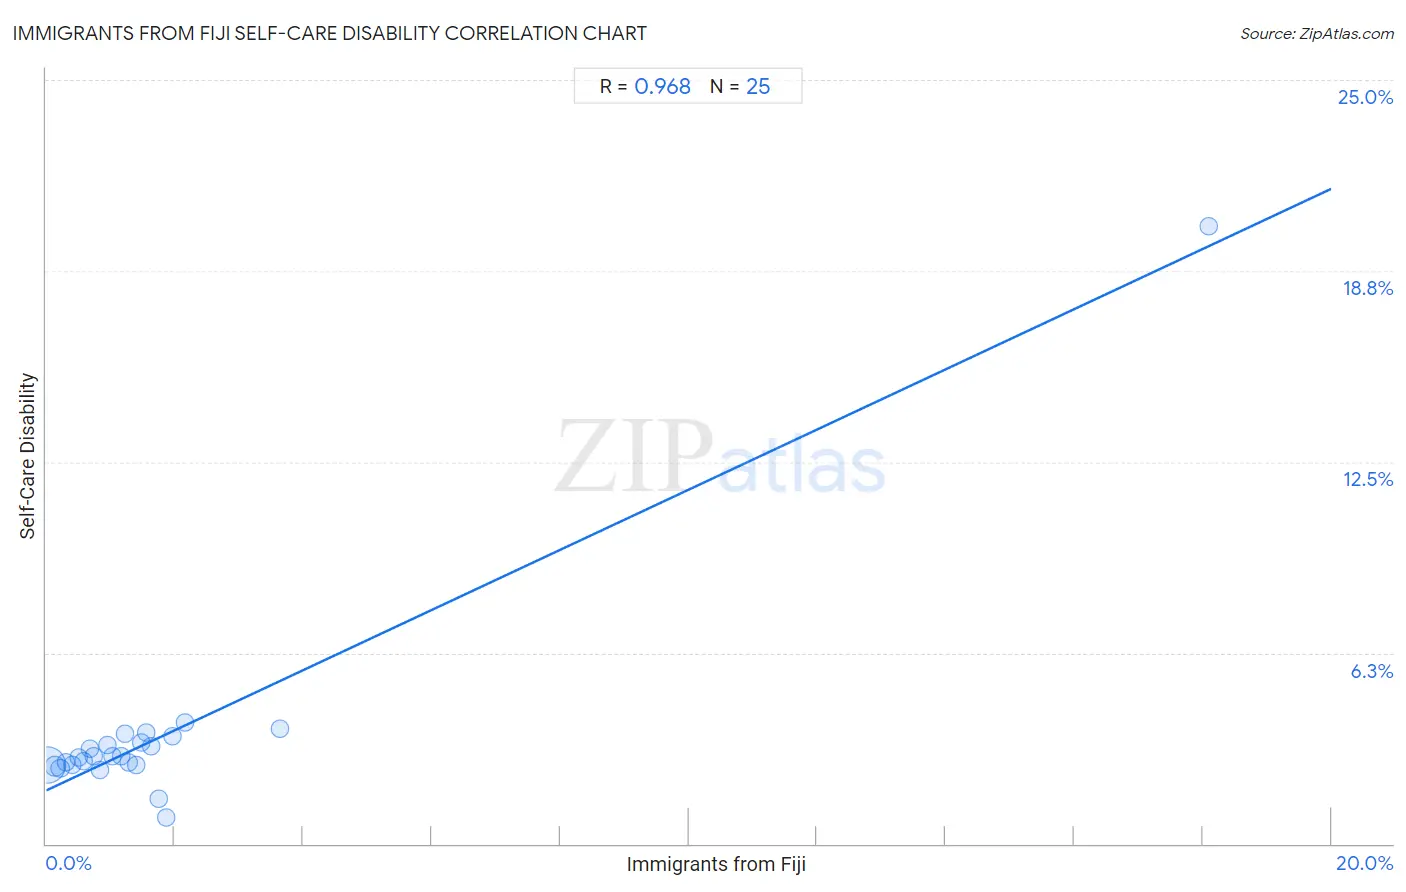
It is essential to understand that the correlation between the percentage of Immigrants from Fiji and percentage of population with self-care disability does not imply a direct cause-and-effect relationship. It remains uncertain whether the presence of Immigrants from Fiji influences an upward or downward trend in the level of percentage of population with self-care disability within an area, or if Immigrants from Fiji simply ended up residing in those areas with higher or lower levels of percentage of population with self-care disability due to other factors.
Demographics Similar to Immigrants from Fiji by Self-Care Disability
In terms of self-care disability, the demographic groups most similar to Immigrants from Fiji are Pima (2.8%, a difference of 0.090%), Immigrants from St. Vincent and the Grenadines (2.8%, a difference of 0.13%), Immigrants from Belize (2.8%, a difference of 0.28%), Cree (2.8%, a difference of 0.43%), and Immigrants from Guyana (2.8%, a difference of 0.47%).
| Demographics | Rating | Rank | Self-Care Disability |
| Belizeans | 0.0 /100 | #293 | Tragic 2.7% |
| Blackfeet | 0.0 /100 | #294 | Tragic 2.7% |
| Barbadians | 0.0 /100 | #295 | Tragic 2.7% |
| Immigrants from Portugal | 0.0 /100 | #296 | Tragic 2.8% |
| West Indians | 0.0 /100 | #297 | Tragic 2.8% |
| Americans | 0.0 /100 | #298 | Tragic 2.8% |
| Immigrants from Guyana | 0.0 /100 | #299 | Tragic 2.8% |
| Immigrants from Fiji | 0.0 /100 | #300 | Tragic 2.8% |
| Pima | 0.0 /100 | #301 | Tragic 2.8% |
| Immigrants from St. Vincent and the Grenadines | 0.0 /100 | #302 | Tragic 2.8% |
| Immigrants from Belize | 0.0 /100 | #303 | Tragic 2.8% |
| Cree | 0.0 /100 | #304 | Tragic 2.8% |
| Immigrants from West Indies | 0.0 /100 | #305 | Tragic 2.8% |
| Aleuts | 0.0 /100 | #306 | Tragic 2.8% |
| Natives/Alaskans | 0.0 /100 | #307 | Tragic 2.8% |
Immigrants from Fiji Self-Care Disability Correlation Summary
| Measurement | Immigrants from Fiji Data | Self-Care Disability Data |
| Minimum | 0.020% | 0.86% |
| Maximum | 18.1% | 20.2% |
| Range | 18.1% | 19.4% |
| Mean | 1.8% | 3.5% |
| Median | 1.2% | 2.9% |
| Interquartile 25% (IQ1) | 0.54% | 2.6% |
| Interquartile 75% (IQ3) | 1.7% | 3.4% |
| Interquartile Range (IQR) | 1.1% | 0.86% |
| Standard Deviation (Sample) | 3.5% | 3.5% |
| Standard Deviation (Population) | 3.4% | 3.5% |
Correlation Details
| Immigrants from Fiji Percentile | Sample Size | Self-Care Disability |
[ 0.0% - 0.5% ] 0.020% | 73,451,045 | 2.6% |
[ 0.0% - 0.5% ] 0.13% | 9,801,783 | 2.5% |
[ 0.0% - 0.5% ] 0.22% | 3,283,370 | 2.5% |
[ 0.0% - 0.5% ] 0.31% | 1,978,289 | 2.7% |
[ 0.0% - 0.5% ] 0.40% | 1,495,895 | 2.6% |
[ 0.0% - 0.5% ] 0.50% | 213,806 | 2.8% |
[ 0.5% - 1.0% ] 0.58% | 532,515 | 2.7% |
[ 0.5% - 1.0% ] 0.68% | 650,145 | 3.1% |
[ 0.5% - 1.0% ] 0.74% | 381,498 | 2.9% |
[ 0.5% - 1.0% ] 0.84% | 174,607 | 2.4% |
[ 0.5% - 1.0% ] 0.96% | 116,498 | 3.2% |
[ 1.0% - 1.5% ] 1.03% | 280,429 | 2.9% |
[ 1.0% - 1.5% ] 1.16% | 609,305 | 2.9% |
[ 1.0% - 1.5% ] 1.22% | 14,291 | 3.6% |
[ 1.0% - 1.5% ] 1.28% | 199,405 | 2.7% |
[ 1.0% - 1.5% ] 1.40% | 110,572 | 2.6% |
[ 1.0% - 1.5% ] 1.48% | 85,410 | 3.3% |
[ 1.5% - 2.0% ] 1.55% | 84,197 | 3.6% |
[ 1.5% - 2.0% ] 1.63% | 77,712 | 3.2% |
[ 1.5% - 2.0% ] 1.75% | 8,920 | 1.5% |
[ 1.5% - 2.0% ] 1.87% | 5,411 | 0.86% |
[ 1.5% - 2.0% ] 1.96% | 60,850 | 3.5% |
[ 2.0% - 2.5% ] 2.15% | 41,599 | 4.0% |
[ 3.5% - 4.0% ] 3.64% | 96,099 | 3.8% |
[ 18.0% - 18.5% ] 18.09% | 188 | 20.2% |