Immigrants from Fiji GED/Equivalency

COMPARE

Immigrants from Fiji
Race
Ancestry
AfghanAfricanAlaska NativeAlaskan AthabascanAlbanianAleutAlsatianAmericanApacheArabArapahoArgentineanArmenianAssyrian/Chaldean/SyriacAustralianAustrianBahamianBangladeshiBarbadianBasqueBelgianBelizeanBermudanBhutaneseBlackfeetBolivianBrazilianBritishBritish West IndianBulgarianBurmeseCajunCambodianCanadianCape VerdeanCarpatho RusynCelticCentral AmericanCentral American IndianCherokeeCheyenneChickasawChileanChineseChippewaChoctawColombianColvilleComancheCosta RicanCreeCreekCroatianCrowCubanCypriotCzechCzechoslovakianDanishDelawareDominicanDutchDutch West IndianEastern EuropeanEcuadorianEgyptianEnglishEstonianEthiopianEuropeanFijianFilipinoFinnishFrenchFrench American IndianFrench CanadianGermanGerman RussianGhanaianGreekGuamanian/ChamorroGuatemalanGuyaneseHaitianHmongHonduranHopiHoumaHungarianIcelanderIndian (Asian)IndonesianInupiatIranianIraqiIrishIroquoisIsraeliItalianJamaicanJapaneseJordanianKenyanKiowaKoreanLaotianLatvianLebaneseLiberianLithuanianLumbeeLuxembourgerMacedonianMalaysianMalteseMarshalleseMenomineeMexicanMexican American IndianMongolianMoroccanNative HawaiianNavajoNepaleseNew ZealanderNicaraguanNigerianNorthern EuropeanNorwegianOkinawanOsageOttawaPaiutePakistaniPalestinianPanamanianParaguayanPennsylvania GermanPeruvianPimaPolishPortuguesePotawatomiPuebloPuerto RicanPuget Sound SalishRomanianRussianSalvadoranSamoanScandinavianScotch-IrishScottishSeminoleSenegaleseSerbianShoshoneSierra LeoneanSiouxSlavicSlovakSloveneSomaliSouth AfricanSouth AmericanSouth American IndianSoviet UnionSpaniardSpanishSpanish AmericanSpanish American IndianSri LankanSubsaharan AfricanSudaneseSwedishSwissSyrianTaiwaneseThaiTlingit-HaidaTohono O'OdhamTonganTrinidadian and TobagonianTsimshianTurkishU.S. Virgin IslanderUgandanUkrainianUruguayanUteVenezuelanVietnameseWelshWest IndianYakamaYaquiYugoslavianYumanYup'ikZimbabwean
Immigration
NonimmigrantsImmigrantsAfghanistanAfricaAlbaniaArgentinaArmeniaAsiaAustraliaAustriaBahamasBangladeshBarbadosBelarusBelgiumBelizeBoliviaBosnia and HerzegovinaBrazilBulgariaBurma/MyanmarCabo VerdeCambodiaCameroonCanadaCaribbeanCentral AmericaChileChinaColombiaCongoCosta RicaCroatiaCubaCzechoslovakiaDenmarkDominicaDominican RepublicEastern AfricaEastern AsiaEastern EuropeEcuadorEgyptEl SalvadorEnglandEritreaEthiopiaEuropeFijiFranceGermanyGhanaGreeceGrenadaGuatemalaGuyanaHaitiHondurasHong KongHungaryIndiaIndonesiaIranIraqIrelandIsraelItalyJamaicaJapanJordanKazakhstanKenyaKoreaKuwaitLaosLatin AmericaLatviaLebanonLiberiaLithuaniaMalaysiaMexicoMicronesiaMiddle AfricaMoldovaMoroccoNepalNetherlandsNicaraguaNigeriaNorth AmericaNorth MacedoniaNorthern AfricaNorthern EuropeNorwayOceaniaPakistanPanamaPeruPhilippinesPolandPortugalRomaniaRussiaSaudi ArabiaScotlandSenegalSerbiaSierra LeoneSingaporeSomaliaSouth AfricaSouth AmericaSouth Central AsiaSouth Eastern AsiaSouthern EuropeSpainSri LankaSt. Vincent and the GrenadinesSudanSwedenSwitzerlandSyriaTaiwanThailandTrinidad and TobagoTurkeyUgandaUkraineUruguayUzbekistanVenezuelaVietnamWest IndiesWestern AfricaWestern AsiaWestern EuropeYemenZaireZimbabweAzores
Select to Compare
Race
Ancestry
AfghanAfricanAlaska NativeAlaskan AthabascanAlbanianAleutAlsatianAmericanApacheArabArapahoArgentineanArmenianAssyrian/Chaldean/SyriacAustralianAustrianBahamianBangladeshiBarbadianBasqueBelgianBelizeanBermudanBhutaneseBlackfeetBolivianBrazilianBritishBritish West IndianBulgarianBurmeseCajunCambodianCanadianCape VerdeanCarpatho RusynCelticCentral AmericanCentral American IndianCherokeeCheyenneChickasawChileanChineseChippewaChoctawColombianColvilleComancheCosta RicanCreeCreekCroatianCrowCubanCypriotCzechCzechoslovakianDanishDelawareDominicanDutchDutch West IndianEastern EuropeanEcuadorianEgyptianEnglishEstonianEthiopianEuropeanFijianFilipinoFinnishFrenchFrench American IndianFrench CanadianGermanGerman RussianGhanaianGreekGuamanian/ChamorroGuatemalanGuyaneseHaitianHmongHonduranHopiHoumaHungarianIcelanderIndian (Asian)IndonesianInupiatIranianIraqiIrishIroquoisIsraeliItalianJamaicanJapaneseJordanianKenyanKiowaKoreanLaotianLatvianLebaneseLiberianLithuanianLumbeeLuxembourgerMacedonianMalaysianMalteseMarshalleseMenomineeMexicanMexican American IndianMongolianMoroccanNative HawaiianNavajoNepaleseNew ZealanderNicaraguanNigerianNorthern EuropeanNorwegianOkinawanOsageOttawaPaiutePakistaniPalestinianPanamanianParaguayanPennsylvania GermanPeruvianPimaPolishPortuguesePotawatomiPuebloPuerto RicanPuget Sound SalishRomanianRussianSalvadoranSamoanScandinavianScotch-IrishScottishSeminoleSenegaleseSerbianShoshoneSierra LeoneanSiouxSlavicSlovakSloveneSomaliSouth AfricanSouth AmericanSouth American IndianSoviet UnionSpaniardSpanishSpanish AmericanSpanish American IndianSri LankanSubsaharan AfricanSudaneseSwedishSwissSyrianTaiwaneseThaiTlingit-HaidaTohono O'OdhamTonganTrinidadian and TobagonianTsimshianTurkishU.S. Virgin IslanderUgandanUkrainianUruguayanUteVenezuelanVietnameseWelshWest IndianYakamaYaquiYugoslavianYumanYup'ikZimbabwean
Immigration
NonimmigrantsImmigrantsAfghanistanAfricaAlbaniaArgentinaArmeniaAsiaAustraliaAustriaBahamasBangladeshBarbadosBelarusBelgiumBelizeBoliviaBosnia and HerzegovinaBrazilBulgariaBurma/MyanmarCabo VerdeCambodiaCameroonCanadaCaribbeanCentral AmericaChileChinaColombiaCongoCosta RicaCroatiaCubaCzechoslovakiaDenmarkDominicaDominican RepublicEastern AfricaEastern AsiaEastern EuropeEcuadorEgyptEl SalvadorEnglandEritreaEthiopiaEuropeFranceGermanyGhanaGreeceGrenadaGuatemalaGuyanaHaitiHondurasHong KongHungaryIndiaIndonesiaIranIraqIrelandIsraelItalyJamaicaJapanJordanKazakhstanKenyaKoreaKuwaitLaosLatin AmericaLatviaLebanonLiberiaLithuaniaMalaysiaMexicoMicronesiaMiddle AfricaMoldovaMoroccoNepalNetherlandsNicaraguaNigeriaNorth AmericaNorth MacedoniaNorthern AfricaNorthern EuropeNorwayOceaniaPakistanPanamaPeruPhilippinesPolandPortugalRomaniaRussiaSaudi ArabiaScotlandSenegalSerbiaSierra LeoneSingaporeSomaliaSouth AfricaSouth AmericaSouth Central AsiaSouth Eastern AsiaSouthern EuropeSpainSri LankaSt. Vincent and the GrenadinesSudanSwedenSwitzerlandSyriaTaiwanThailandTrinidad and TobagoTurkeyUgandaUkraineUruguayUzbekistanVenezuelaVietnamWest IndiesWestern AfricaWestern AsiaWestern EuropeYemenZaireZimbabweAzores
GED/Equivalency
Income
Poverty
Unemployment
Labor Participation
Family Structure
Vehicle Availability
Education Level
Disability

Immigrants from Fiji GED/Equivalency
Tragic

82.7%
GED/EQUIVALENCY
0.1/ 100
METRIC RATING
279th/ 347
METRIC RANK

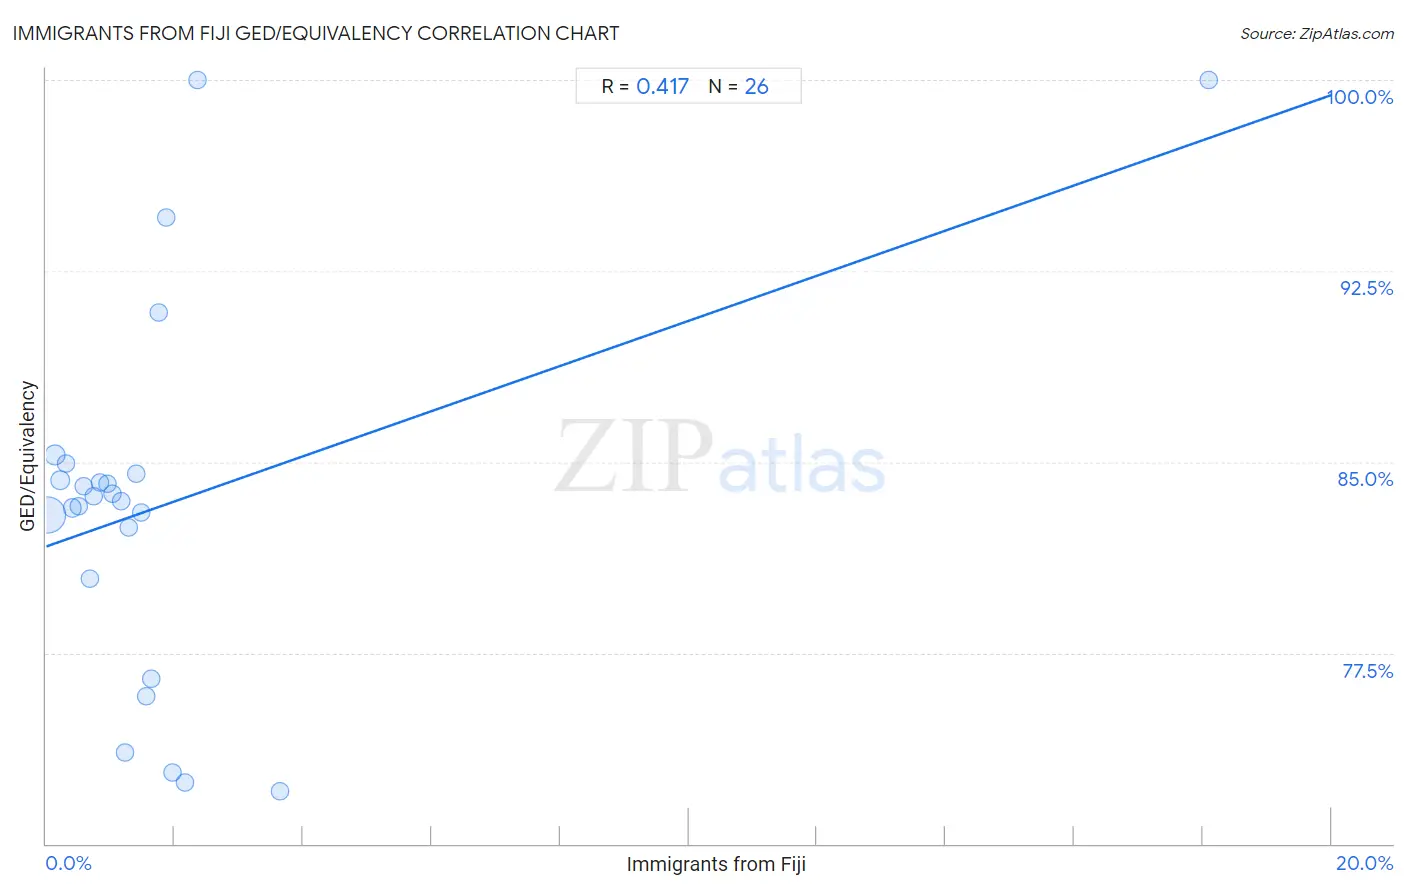
Immigrants from Fiji GED/Equivalency Correlation Chart

The statistical analysis conducted on geographies consisting of 93,756,204 people shows a moderate positive correlation between the proportion of Immigrants from Fiji and percentage of population with at least ged/equivalency education in the United States with a correlation coefficient (R) of 0.417 and weighted average of 82.7%. On average, for every 1% (one percent) increase in Immigrants from Fiji within a typical geography, there is an increase of 0.89% in percentage of population with at least ged/equivalency education.
Immigrants from Fiji GED/Equivalency
It is essential to understand that the correlation between the percentage of Immigrants from Fiji and percentage of population with at least ged/equivalency education does not imply a direct cause-and-effect relationship. It remains uncertain whether the presence of Immigrants from Fiji influences an upward or downward trend in the level of percentage of population with at least ged/equivalency education within an area, or if Immigrants from Fiji simply ended up residing in those areas with higher or lower levels of percentage of population with at least ged/equivalency education due to other factors.

Demographics Similar to Immigrants from Fiji by GED/Equivalency

In terms of ged/equivalency, the demographic groups most similar to Immigrants from Fiji are Immigrants from Laos (82.7%, a difference of 0.010%), Cheyenne (82.7%, a difference of 0.010%), Arapaho (82.8%, a difference of 0.040%), Black/African American (82.8%, a difference of 0.060%), and Seminole (82.8%, a difference of 0.080%).
DemographicsRating | RankGED/Equivalency
Barbadians
0.1
/100
|
#272
Tragic
82.9%
Pennsylvania Germans
0.1
/100
|
#273
Tragic
82.9%
Immigrants from Trinidad and Tobago
0.1
/100
|
#274
Tragic
82.8%
Seminole
0.1
/100
|
#275
Tragic
82.8%
Blacks/African Americans
0.1
/100
|
#276
Tragic
82.8%
Arapaho
0.1
/100
|
#277
Tragic
82.8%
Immigrants from Laos
0.1
/100
|
#278
Tragic
82.7%
Immigrants from Fiji
0.1
/100
|
#279
Tragic
82.7%
Cheyenne
0.1
/100
|
#280
Tragic
82.7%
Sioux
0.1
/100
|
#281
Tragic
82.6%
Immigrants
0.1
/100
|
#282
Tragic
82.6%
Indonesians
0.1
/100
|
#283
Tragic
82.5%
Immigrants from Barbados
0.1
/100
|
#284
Tragic
82.4%
Cajuns
0.0
/100
|
#285
Tragic
82.4%
Immigrants from West Indies
0.0
/100
|
#286
Tragic
82.4%

Immigrants from Fiji GED/Equivalency Correlation Summary

MeasurementImmigrants from Fiji DataGED/Equivalency Data
Minimum0.020%72.1%
Maximum18.1%100.0%
Range18.1%27.9%
Mean1.8%83.3%
Median1.2%83.6%
Interquartile 25% (IQ1)0.58%80.4%
Interquartile 75% (IQ3)1.7%84.6%
Interquartile Range (IQR)1.2%4.2%
Standard Deviation (Sample)3.4%7.3%
Standard Deviation (Population)3.3%7.1%

Correlation Details

Immigrants from Fiji PercentileSample SizeGED/Equivalency
[
0.0%
-
0.5%
]
0.020%
73,451,04582.9%
[
0.0%
-
0.5%
]
0.13%
9,801,78385.2%
[
0.0%
-
0.5%
]
0.22%
3,283,37084.3%
[
0.0%
-
0.5%
]
0.31%
1,978,28984.9%
[
0.0%
-
0.5%
]
0.40%
1,496,95683.2%
[
0.0%
-
0.5%
]
0.50%
213,80683.3%
[
0.5%
-
1.0%
]
0.58%
532,51584.0%
[
0.5%
-
1.0%
]
0.68%
650,14580.4%
[
0.5%
-
1.0%
]
0.74%
381,49883.7%
[
0.5%
-
1.0%
]
0.84%
175,08784.2%
[
0.5%
-
1.0%
]
0.96%
116,49884.1%
[
1.0%
-
1.5%
]
1.03%
280,42983.7%
[
1.0%
-
1.5%
]
1.16%
609,30583.5%
[
1.0%
-
1.5%
]
1.22%
14,29173.6%
[
1.0%
-
1.5%
]
1.28%
199,40582.4%
[
1.0%
-
1.5%
]
1.40%
110,92984.6%
[
1.0%
-
1.5%
]
1.48%
85,41083.0%
[
1.5%
-
2.0%
]
1.55%
84,19775.8%
[
1.5%
-
2.0%
]
1.63%
77,71276.5%
[
1.5%
-
2.0%
]
1.75%
8,92090.9%
[
1.5%
-
2.0%
]
1.87%
5,41194.6%
[
1.5%
-
2.0%
]
1.96%
60,85072.8%
[
2.0%
-
2.5%
]
2.15%
41,59972.4%
[
2.0%
-
2.5%
]
2.36%
467100.0%
[
3.5%
-
4.0%
]
3.64%
96,09972.1%
[
18.0%
-
18.5%
]
18.09%
188100.0%