Immigrants from El Salvador 4 or more Vehicles in Household
COMPARE
Immigrants from El Salvador
Select to Compare
4 or more Vehicles in Household
Immigrants from El Salvador 4 or more Vehicles in Household
7.7%
4+ VEHICLES AVAILABLE
100.0/ 100
METRIC RATING
50th/ 347
METRIC RANK
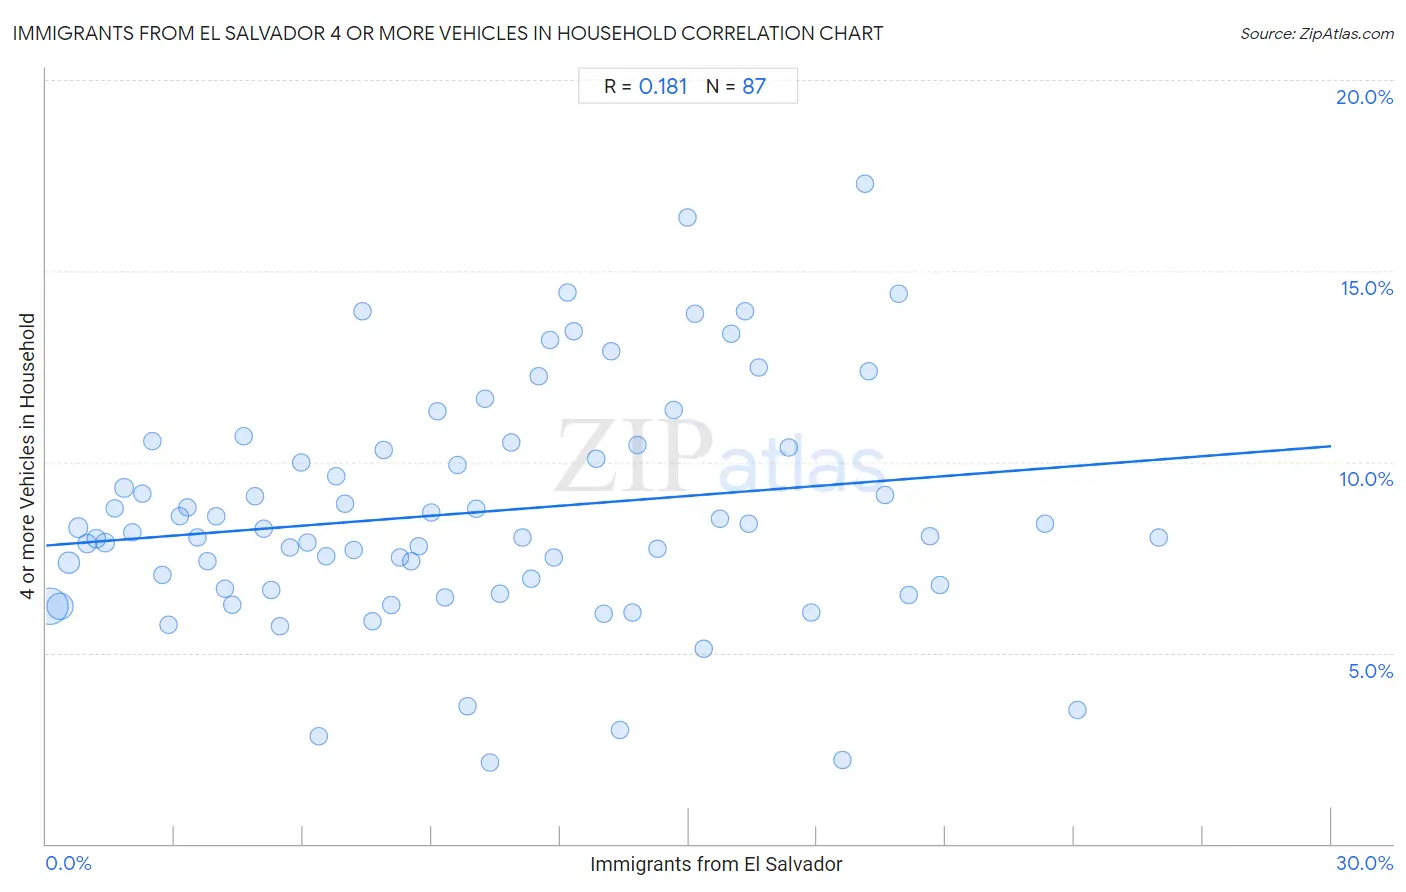
Immigrants from El Salvador 4 or more Vehicles in Household Correlation Chart
The statistical analysis conducted on geographies consisting of 356,356,218 people shows a poor positive correlation between the proportion of Immigrants from El Salvador and percentage of households with 4 or more vehicles available in the United States with a correlation coefficient (R) of 0.181 and weighted average of 7.7%. On average, for every 1% (one percent) increase in Immigrants from El Salvador within a typical geography, there is an increase of 0.087% in percentage of households with 4 or more vehicles available.
It is essential to understand that the correlation between the percentage of Immigrants from El Salvador and percentage of households with 4 or more vehicles available does not imply a direct cause-and-effect relationship. It remains uncertain whether the presence of Immigrants from El Salvador influences an upward or downward trend in the level of percentage of households with 4 or more vehicles available within an area, or if Immigrants from El Salvador simply ended up residing in those areas with higher or lower levels of percentage of households with 4 or more vehicles available due to other factors.
Demographics Similar to Immigrants from El Salvador by 4 or more Vehicles in Household
In terms of 4 or more vehicles in household, the demographic groups most similar to Immigrants from El Salvador are Cherokee (7.7%, a difference of 0.16%), Swiss (7.8%, a difference of 0.35%), Immigrants from Laos (7.7%, a difference of 0.35%), Japanese (7.7%, a difference of 0.47%), and Osage (7.8%, a difference of 0.52%).
| Demographics | Rating | Rank | 4 or more Vehicles in Household |
| Fijians | 100.0 /100 | #43 | Exceptional 7.8% |
| Bhutanese | 100.0 /100 | #44 | Exceptional 7.8% |
| Choctaw | 100.0 /100 | #45 | Exceptional 7.8% |
| Crow | 100.0 /100 | #46 | Exceptional 7.8% |
| Osage | 100.0 /100 | #47 | Exceptional 7.8% |
| Swiss | 100.0 /100 | #48 | Exceptional 7.8% |
| Cherokee | 100.0 /100 | #49 | Exceptional 7.7% |
| Immigrants from El Salvador | 100.0 /100 | #50 | Exceptional 7.7% |
| Immigrants from Laos | 100.0 /100 | #51 | Exceptional 7.7% |
| Japanese | 100.0 /100 | #52 | Exceptional 7.7% |
| Malaysians | 100.0 /100 | #53 | Exceptional 7.7% |
| Dutch | 100.0 /100 | #54 | Exceptional 7.7% |
| Immigrants from Oceania | 100.0 /100 | #55 | Exceptional 7.6% |
| English | 100.0 /100 | #56 | Exceptional 7.6% |
| Pennsylvania Germans | 100.0 /100 | #57 | Exceptional 7.6% |
Immigrants from El Salvador 4 or more Vehicles in Household Correlation Summary
| Measurement | Immigrants from El Salvador Data | 4 or more Vehicles in Household Data |
| Minimum | 0.094% | 2.1% |
| Maximum | 26.0% | 17.3% |
| Range | 25.9% | 15.2% |
| Mean | 9.9% | 8.7% |
| Median | 9.3% | 8.2% |
| Interquartile 25% (IQ1) | 4.6% | 6.7% |
| Interquartile 75% (IQ3) | 14.6% | 10.4% |
| Interquartile Range (IQR) | 10.0% | 3.7% |
| Standard Deviation (Sample) | 6.4% | 3.0% |
| Standard Deviation (Population) | 6.3% | 3.0% |
Correlation Details
| Immigrants from El Salvador Percentile | Sample Size | 4 or more Vehicles in Household |
[ 0.0% - 0.5% ] 0.094% | 159,552,761 | 6.2% |
[ 0.0% - 0.5% ] 0.32% | 73,659,950 | 6.2% |
[ 0.5% - 1.0% ] 0.53% | 29,103,132 | 7.4% |
[ 0.5% - 1.0% ] 0.75% | 18,388,845 | 8.3% |
[ 0.5% - 1.0% ] 0.96% | 15,133,330 | 7.9% |
[ 1.0% - 1.5% ] 1.16% | 9,984,971 | 8.0% |
[ 1.0% - 1.5% ] 1.39% | 8,323,538 | 7.9% |
[ 1.5% - 2.0% ] 1.60% | 5,669,478 | 8.8% |
[ 1.5% - 2.0% ] 1.82% | 4,169,605 | 9.3% |
[ 2.0% - 2.5% ] 2.02% | 2,809,509 | 8.2% |
[ 2.0% - 2.5% ] 2.24% | 2,876,696 | 9.2% |
[ 2.0% - 2.5% ] 2.47% | 2,170,969 | 10.6% |
[ 2.5% - 3.0% ] 2.70% | 1,820,572 | 7.0% |
[ 2.5% - 3.0% ] 2.85% | 3,605,473 | 5.7% |
[ 3.0% - 3.5% ] 3.11% | 1,221,453 | 8.6% |
[ 3.0% - 3.5% ] 3.30% | 1,085,652 | 8.8% |
[ 3.5% - 4.0% ] 3.52% | 1,059,540 | 8.0% |
[ 3.5% - 4.0% ] 3.76% | 871,752 | 7.4% |
[ 3.5% - 4.0% ] 3.97% | 635,532 | 8.6% |
[ 4.0% - 4.5% ] 4.19% | 509,388 | 6.7% |
[ 4.0% - 4.5% ] 4.35% | 4,433,557 | 6.2% |
[ 4.5% - 5.0% ] 4.62% | 676,745 | 10.7% |
[ 4.5% - 5.0% ] 4.87% | 605,902 | 9.1% |
[ 5.0% - 5.5% ] 5.07% | 599,547 | 8.2% |
[ 5.0% - 5.5% ] 5.25% | 297,910 | 6.6% |
[ 5.0% - 5.5% ] 5.47% | 697,906 | 5.7% |
[ 5.5% - 6.0% ] 5.69% | 376,239 | 7.8% |
[ 5.5% - 6.0% ] 5.94% | 217,826 | 10.0% |
[ 6.0% - 6.5% ] 6.11% | 244,235 | 7.9% |
[ 6.0% - 6.5% ] 6.35% | 150,698 | 2.8% |
[ 6.5% - 7.0% ] 6.53% | 461,360 | 7.5% |
[ 6.5% - 7.0% ] 6.76% | 398,482 | 9.6% |
[ 6.5% - 7.0% ] 6.98% | 103,069 | 8.9% |
[ 7.0% - 7.5% ] 7.17% | 170,770 | 7.7% |
[ 7.0% - 7.5% ] 7.37% | 291,995 | 13.9% |
[ 7.5% - 8.0% ] 7.62% | 242,271 | 5.8% |
[ 7.5% - 8.0% ] 7.89% | 84,623 | 10.3% |
[ 8.0% - 8.5% ] 8.07% | 109,881 | 6.2% |
[ 8.0% - 8.5% ] 8.26% | 367,588 | 7.5% |
[ 8.5% - 9.0% ] 8.53% | 339,140 | 7.4% |
[ 8.5% - 9.0% ] 8.71% | 164,080 | 7.8% |
[ 8.5% - 9.0% ] 8.98% | 101,884 | 8.7% |
[ 9.0% - 9.5% ] 9.13% | 155,953 | 11.3% |
[ 9.0% - 9.5% ] 9.32% | 326,786 | 6.5% |
[ 9.5% - 10.0% ] 9.59% | 94,609 | 9.9% |
[ 9.5% - 10.0% ] 9.82% | 137,981 | 3.6% |
[ 10.0% - 10.5% ] 10.05% | 103,253 | 8.8% |
[ 10.0% - 10.5% ] 10.25% | 33,408 | 11.7% |
[ 10.0% - 10.5% ] 10.37% | 64,890 | 2.1% |
[ 10.5% - 11.0% ] 10.59% | 114,601 | 6.6% |
[ 10.5% - 11.0% ] 10.85% | 9,431 | 10.5% |
[ 11.0% - 11.5% ] 11.12% | 25,324 | 8.0% |
[ 11.0% - 11.5% ] 11.32% | 201,194 | 6.9% |
[ 11.0% - 11.5% ] 11.49% | 44,814 | 12.3% |
[ 11.5% - 12.0% ] 11.76% | 4,958 | 13.2% |
[ 11.5% - 12.0% ] 11.84% | 32,191 | 7.5% |
[ 12.0% - 12.5% ] 12.16% | 59,604 | 14.4% |
[ 12.0% - 12.5% ] 12.30% | 91,938 | 13.4% |
[ 12.5% - 13.0% ] 12.84% | 126,256 | 10.1% |
[ 13.0% - 13.5% ] 13.01% | 85,124 | 6.0% |
[ 13.0% - 13.5% ] 13.19% | 74,842 | 12.9% |
[ 13.0% - 13.5% ] 13.40% | 120,534 | 3.0% |
[ 13.5% - 14.0% ] 13.69% | 22,966 | 6.1% |
[ 13.5% - 14.0% ] 13.80% | 32,061 | 10.4% |
[ 14.0% - 14.5% ] 14.26% | 2,118 | 7.7% |
[ 14.5% - 15.0% ] 14.64% | 87,056 | 11.4% |
[ 14.5% - 15.0% ] 14.97% | 154,449 | 16.4% |
[ 15.0% - 15.5% ] 15.14% | 766 | 13.9% |
[ 15.0% - 15.5% ] 15.36% | 34,625 | 5.1% |
[ 15.5% - 16.0% ] 15.74% | 1,328 | 8.5% |
[ 15.5% - 16.0% ] 16.00% | 3,325 | 13.3% |
[ 16.0% - 16.5% ] 16.32% | 15,127 | 13.9% |
[ 16.0% - 16.5% ] 16.40% | 16,944 | 8.4% |
[ 16.5% - 17.0% ] 16.63% | 6,947 | 12.5% |
[ 17.0% - 17.5% ] 17.32% | 6,218 | 10.4% |
[ 17.5% - 18.0% ] 17.85% | 24,744 | 6.1% |
[ 18.5% - 19.0% ] 18.59% | 84,133 | 2.2% |
[ 19.0% - 19.5% ] 19.10% | 9,031 | 17.3% |
[ 19.0% - 19.5% ] 19.20% | 7,094 | 12.4% |
[ 19.5% - 20.0% ] 19.59% | 1,751 | 9.1% |
[ 19.5% - 20.0% ] 19.89% | 10,563 | 14.4% |
[ 20.0% - 20.5% ] 20.12% | 18,080 | 6.5% |
[ 20.5% - 21.0% ] 20.62% | 50,387 | 8.0% |
[ 20.5% - 21.0% ] 20.87% | 35,908 | 6.8% |
[ 23.0% - 23.5% ] 23.33% | 14,736 | 8.4% |
[ 24.0% - 24.5% ] 24.09% | 5,949 | 3.5% |
[ 25.5% - 26.0% ] 25.98% | 14,367 | 8.0% |