Immigrants from El Salvador Self-Care Disability
COMPARE
Immigrants from El Salvador
Select to Compare
Self-Care Disability
Immigrants from El Salvador Self-Care Disability
2.5%
SELF-CARE DISABILITY
33.0/ 100
METRIC RATING
186th/ 347
METRIC RANK
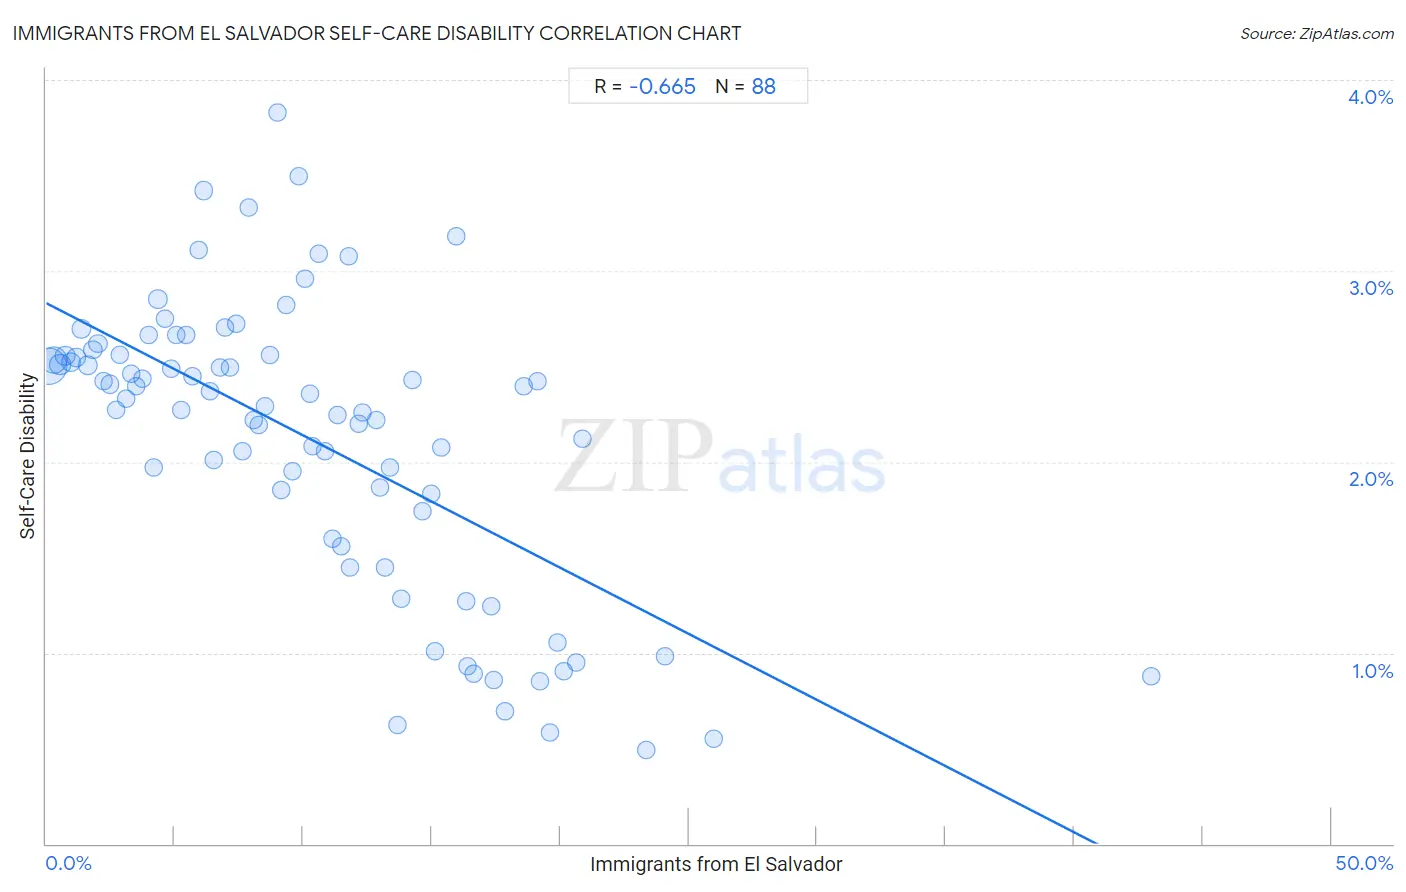
Immigrants from El Salvador Self-Care Disability Correlation Chart
The statistical analysis conducted on geographies consisting of 357,509,319 people shows a significant negative correlation between the proportion of Immigrants from El Salvador and percentage of population with self-care disability in the United States with a correlation coefficient (R) of -0.665 and weighted average of 2.5%. On average, for every 1% (one percent) increase in Immigrants from El Salvador within a typical geography, there is a decrease of 0.069% in percentage of population with self-care disability.
It is essential to understand that the correlation between the percentage of Immigrants from El Salvador and percentage of population with self-care disability does not imply a direct cause-and-effect relationship. It remains uncertain whether the presence of Immigrants from El Salvador influences an upward or downward trend in the level of percentage of population with self-care disability within an area, or if Immigrants from El Salvador simply ended up residing in those areas with higher or lower levels of percentage of population with self-care disability due to other factors.
Demographics Similar to Immigrants from El Salvador by Self-Care Disability
In terms of self-care disability, the demographic groups most similar to Immigrants from El Salvador are Slavic (2.5%, a difference of 0.070%), Yugoslavian (2.5%, a difference of 0.17%), Salvadoran (2.5%, a difference of 0.18%), Maltese (2.5%, a difference of 0.23%), and Irish (2.5%, a difference of 0.23%).
| Demographics | Rating | Rank | Self-Care Disability |
| Hungarians | 45.5 /100 | #179 | Average 2.5% |
| Indonesians | 41.2 /100 | #180 | Average 2.5% |
| Ghanaians | 40.4 /100 | #181 | Average 2.5% |
| Maltese | 37.5 /100 | #182 | Fair 2.5% |
| Salvadorans | 36.4 /100 | #183 | Fair 2.5% |
| Yugoslavians | 36.1 /100 | #184 | Fair 2.5% |
| Slavs | 34.3 /100 | #185 | Fair 2.5% |
| Immigrants from El Salvador | 33.0 /100 | #186 | Fair 2.5% |
| Irish | 28.7 /100 | #187 | Fair 2.5% |
| Immigrants from Oceania | 28.3 /100 | #188 | Fair 2.5% |
| Immigrants from Eastern Europe | 28.0 /100 | #189 | Fair 2.5% |
| Sioux | 24.6 /100 | #190 | Fair 2.5% |
| Moroccans | 22.9 /100 | #191 | Fair 2.5% |
| Soviet Union | 22.2 /100 | #192 | Fair 2.5% |
| Ukrainians | 21.4 /100 | #193 | Fair 2.5% |
Immigrants from El Salvador Self-Care Disability Correlation Summary
| Measurement | Immigrants from El Salvador Data | Self-Care Disability Data |
| Minimum | 0.094% | 0.49% |
| Maximum | 43.0% | 3.8% |
| Range | 42.9% | 3.3% |
| Mean | 10.3% | 2.1% |
| Median | 9.5% | 2.3% |
| Interquartile 25% (IQ1) | 4.7% | 1.7% |
| Interquartile 75% (IQ3) | 14.8% | 2.6% |
| Interquartile Range (IQR) | 10.1% | 0.89% |
| Standard Deviation (Sample) | 7.2% | 0.76% |
| Standard Deviation (Population) | 7.2% | 0.75% |
Correlation Details
| Immigrants from El Salvador Percentile | Sample Size | Self-Care Disability |
[ 0.0% - 0.5% ] 0.094% | 160,103,060 | 2.5% |
[ 0.0% - 0.5% ] 0.32% | 73,828,146 | 2.5% |
[ 0.5% - 1.0% ] 0.53% | 29,293,957 | 2.5% |
[ 0.5% - 1.0% ] 0.75% | 18,398,576 | 2.6% |
[ 0.5% - 1.0% ] 0.96% | 15,214,097 | 2.5% |
[ 1.0% - 1.5% ] 1.16% | 10,019,648 | 2.5% |
[ 1.0% - 1.5% ] 1.39% | 8,393,741 | 2.7% |
[ 1.5% - 2.0% ] 1.60% | 5,671,569 | 2.5% |
[ 1.5% - 2.0% ] 1.82% | 4,185,420 | 2.6% |
[ 2.0% - 2.5% ] 2.02% | 2,820,374 | 2.6% |
[ 2.0% - 2.5% ] 2.24% | 2,871,983 | 2.4% |
[ 2.0% - 2.5% ] 2.47% | 2,192,968 | 2.4% |
[ 2.5% - 3.0% ] 2.70% | 1,842,674 | 2.3% |
[ 2.5% - 3.0% ] 2.85% | 3,612,574 | 2.6% |
[ 3.0% - 3.5% ] 3.11% | 1,214,082 | 2.3% |
[ 3.0% - 3.5% ] 3.30% | 1,087,557 | 2.5% |
[ 3.5% - 4.0% ] 3.52% | 1,051,148 | 2.4% |
[ 3.5% - 4.0% ] 3.76% | 869,084 | 2.4% |
[ 3.5% - 4.0% ] 3.97% | 635,532 | 2.7% |
[ 4.0% - 4.5% ] 4.18% | 508,632 | 2.0% |
[ 4.0% - 4.5% ] 4.35% | 4,433,557 | 2.9% |
[ 4.5% - 5.0% ] 4.62% | 676,745 | 2.7% |
[ 4.5% - 5.0% ] 4.87% | 601,028 | 2.5% |
[ 5.0% - 5.5% ] 5.07% | 598,720 | 2.7% |
[ 5.0% - 5.5% ] 5.25% | 298,078 | 2.3% |
[ 5.0% - 5.5% ] 5.47% | 697,906 | 2.7% |
[ 5.5% - 6.0% ] 5.69% | 374,196 | 2.4% |
[ 5.5% - 6.0% ] 5.94% | 216,542 | 3.1% |
[ 6.0% - 6.5% ] 6.11% | 246,715 | 3.4% |
[ 6.0% - 6.5% ] 6.35% | 150,984 | 2.4% |
[ 6.5% - 7.0% ] 6.53% | 459,873 | 2.0% |
[ 6.5% - 7.0% ] 6.76% | 398,215 | 2.5% |
[ 6.5% - 7.0% ] 6.98% | 103,069 | 2.7% |
[ 7.0% - 7.5% ] 7.17% | 171,306 | 2.5% |
[ 7.0% - 7.5% ] 7.37% | 291,995 | 2.7% |
[ 7.5% - 8.0% ] 7.62% | 239,849 | 2.1% |
[ 7.5% - 8.0% ] 7.89% | 84,623 | 3.3% |
[ 8.0% - 8.5% ] 8.07% | 109,881 | 2.2% |
[ 8.0% - 8.5% ] 8.26% | 367,396 | 2.2% |
[ 8.5% - 9.0% ] 8.53% | 339,140 | 2.3% |
[ 8.5% - 9.0% ] 8.71% | 164,080 | 2.6% |
[ 8.5% - 9.0% ] 8.98% | 101,784 | 3.8% |
[ 9.0% - 9.5% ] 9.13% | 155,953 | 1.9% |
[ 9.0% - 9.5% ] 9.32% | 326,786 | 2.8% |
[ 9.5% - 10.0% ] 9.59% | 95,999 | 2.0% |
[ 9.5% - 10.0% ] 9.82% | 136,570 | 3.5% |
[ 10.0% - 10.5% ] 10.05% | 103,551 | 3.0% |
[ 10.0% - 10.5% ] 10.25% | 33,408 | 2.4% |
[ 10.0% - 10.5% ] 10.37% | 64,890 | 2.1% |
[ 10.5% - 11.0% ] 10.59% | 114,601 | 3.1% |
[ 10.5% - 11.0% ] 10.85% | 9,431 | 2.1% |
[ 11.0% - 11.5% ] 11.12% | 25,324 | 1.6% |
[ 11.0% - 11.5% ] 11.32% | 201,194 | 2.2% |
[ 11.0% - 11.5% ] 11.49% | 44,814 | 1.6% |
[ 11.5% - 12.0% ] 11.76% | 4,328 | 3.1% |
[ 11.5% - 12.0% ] 11.84% | 32,191 | 1.4% |
[ 12.0% - 12.5% ] 12.15% | 58,064 | 2.2% |
[ 12.0% - 12.5% ] 12.30% | 91,938 | 2.3% |
[ 12.5% - 13.0% ] 12.84% | 126,256 | 2.2% |
[ 13.0% - 13.5% ] 13.01% | 85,124 | 1.9% |
[ 13.0% - 13.5% ] 13.19% | 75,956 | 1.4% |
[ 13.0% - 13.5% ] 13.40% | 120,534 | 2.0% |
[ 13.5% - 14.0% ] 13.69% | 22,966 | 0.62% |
[ 13.5% - 14.0% ] 13.80% | 31,411 | 1.3% |
[ 14.0% - 14.5% ] 14.26% | 2,118 | 2.4% |
[ 14.5% - 15.0% ] 14.64% | 87,056 | 1.7% |
[ 14.5% - 15.0% ] 14.97% | 154,449 | 1.8% |
[ 15.0% - 15.5% ] 15.14% | 766 | 1.0% |
[ 15.0% - 15.5% ] 15.36% | 34,625 | 2.1% |
[ 15.5% - 16.0% ] 15.97% | 2,568 | 3.2% |
[ 16.0% - 16.5% ] 16.32% | 15,127 | 1.3% |
[ 16.0% - 16.5% ] 16.40% | 16,944 | 0.93% |
[ 16.5% - 17.0% ] 16.63% | 6,947 | 0.89% |
[ 17.0% - 17.5% ] 17.32% | 6,218 | 1.2% |
[ 17.0% - 17.5% ] 17.42% | 3,851 | 0.86% |
[ 17.5% - 18.0% ] 17.85% | 24,744 | 0.69% |
[ 18.5% - 19.0% ] 18.59% | 84,133 | 2.4% |
[ 19.0% - 19.5% ] 19.10% | 9,031 | 2.4% |
[ 19.0% - 19.5% ] 19.20% | 7,094 | 0.85% |
[ 19.5% - 20.0% ] 19.59% | 1,751 | 0.58% |
[ 19.5% - 20.0% ] 19.89% | 10,563 | 1.1% |
[ 20.0% - 20.5% ] 20.12% | 18,080 | 0.91% |
[ 20.5% - 21.0% ] 20.62% | 50,387 | 0.95% |
[ 20.5% - 21.0% ] 20.87% | 35,908 | 2.1% |
[ 23.0% - 23.5% ] 23.33% | 14,736 | 0.49% |
[ 24.0% - 24.5% ] 24.09% | 5,949 | 0.98% |
[ 25.5% - 26.0% ] 25.98% | 14,367 | 0.55% |
[ 42.5% - 43.0% ] 42.98% | 114 | 0.88% |