Immigrants from El Salvador Wage/Income Gap
COMPARE
Immigrants from El Salvador
Select to Compare
Wage/Income Gap
Immigrants from El Salvador Wage/Income Gap
22.8%
WAGE/INCOME GAP
99.9/ 100
METRIC RATING
71st/ 347
METRIC RANK
Immigrants from El Salvador Wage/Income Gap Correlation Chart
The statistical analysis conducted on geographies consisting of 357,610,247 people shows a poor positive correlation between the proportion of Immigrants from El Salvador and wage/income gap percentage in the United States with a correlation coefficient (R) of 0.186 and weighted average of 22.8%. On average, for every 1% (one percent) increase in Immigrants from El Salvador within a typical geography, there is an increase of 0.20% in wage/income gap percentage.
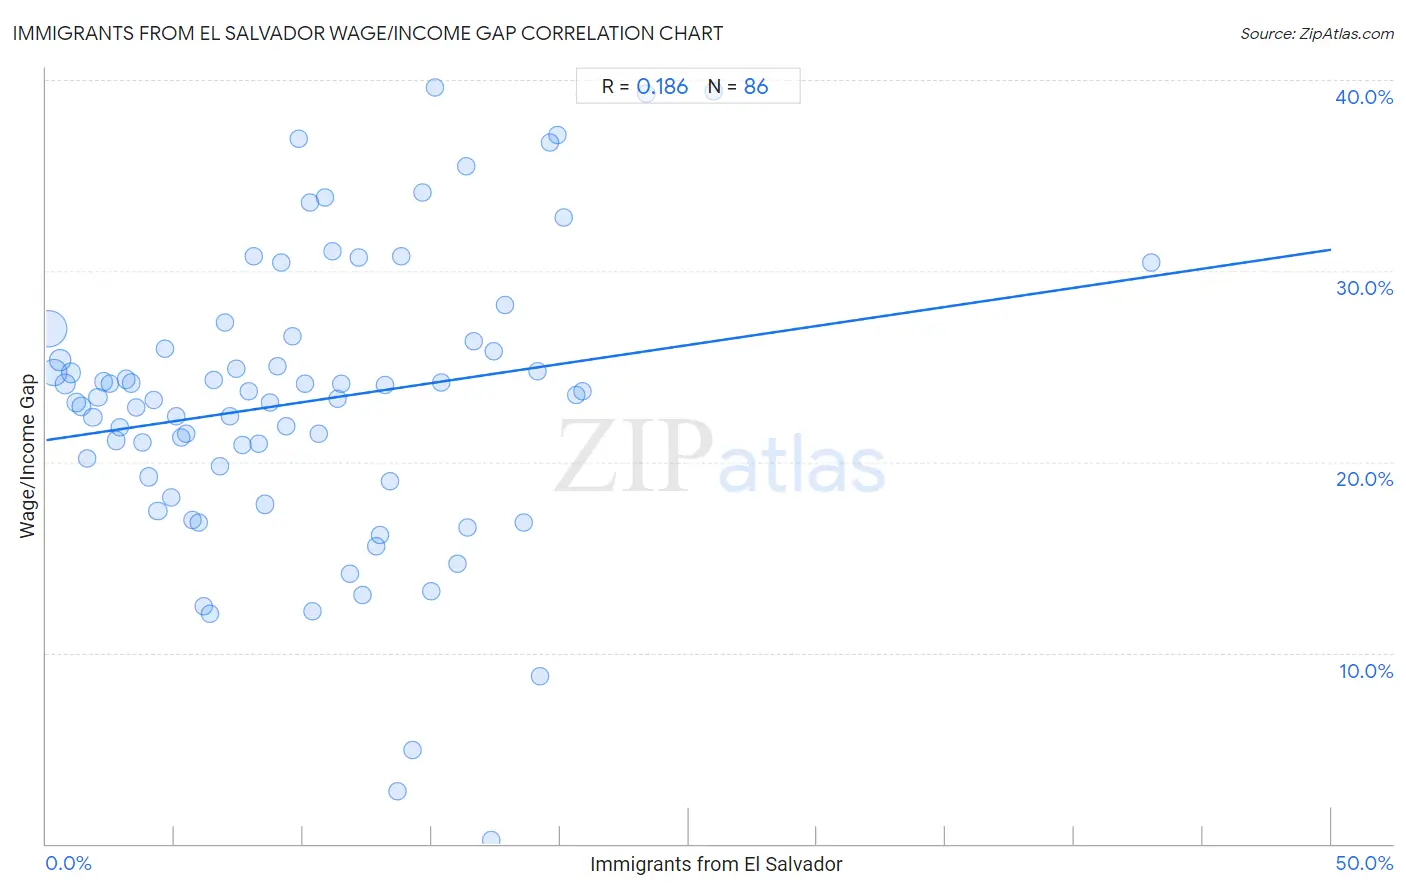
It is essential to understand that the correlation between the percentage of Immigrants from El Salvador and wage/income gap percentage does not imply a direct cause-and-effect relationship. It remains uncertain whether the presence of Immigrants from El Salvador influences an upward or downward trend in the level of wage/income gap percentage within an area, or if Immigrants from El Salvador simply ended up residing in those areas with higher or lower levels of wage/income gap percentage due to other factors.
Demographics Similar to Immigrants from El Salvador by Wage/Income Gap
In terms of wage/income gap, the demographic groups most similar to Immigrants from El Salvador are Subsaharan African (22.8%, a difference of 0.15%), Immigrants from Uzbekistan (22.7%, a difference of 0.17%), Immigrants from Eastern Africa (22.8%, a difference of 0.18%), Immigrants from Burma/Myanmar (22.8%, a difference of 0.26%), and Indonesian (22.7%, a difference of 0.28%).
| Demographics | Rating | Rank | Wage/Income Gap |
| Spanish American Indians | 100.0 /100 | #64 | Exceptional 22.5% |
| Guatemalans | 99.9 /100 | #65 | Exceptional 22.6% |
| Central American Indians | 99.9 /100 | #66 | Exceptional 22.7% |
| Menominee | 99.9 /100 | #67 | Exceptional 22.7% |
| Immigrants from Nigeria | 99.9 /100 | #68 | Exceptional 22.7% |
| Indonesians | 99.9 /100 | #69 | Exceptional 22.7% |
| Immigrants from Uzbekistan | 99.9 /100 | #70 | Exceptional 22.7% |
| Immigrants from El Salvador | 99.9 /100 | #71 | Exceptional 22.8% |
| Sub-Saharan Africans | 99.9 /100 | #72 | Exceptional 22.8% |
| Immigrants from Eastern Africa | 99.9 /100 | #73 | Exceptional 22.8% |
| Immigrants from Burma/Myanmar | 99.9 /100 | #74 | Exceptional 22.8% |
| Fijians | 99.9 /100 | #75 | Exceptional 22.9% |
| Ecuadorians | 99.9 /100 | #76 | Exceptional 22.9% |
| Africans | 99.9 /100 | #77 | Exceptional 22.9% |
| Nigerians | 99.9 /100 | #78 | Exceptional 23.0% |
Immigrants from El Salvador Wage/Income Gap Correlation Summary
| Measurement | Immigrants from El Salvador Data | Wage/Income Gap Data |
| Minimum | 0.094% | 0.18% |
| Maximum | 43.0% | 39.6% |
| Range | 42.9% | 39.4% |
| Mean | 10.1% | 23.2% |
| Median | 9.2% | 23.4% |
| Interquartile 25% (IQ1) | 4.6% | 19.2% |
| Interquartile 75% (IQ3) | 14.6% | 26.3% |
| Interquartile Range (IQR) | 10.0% | 7.1% |
| Standard Deviation (Sample) | 7.2% | 7.7% |
| Standard Deviation (Population) | 7.1% | 7.7% |
Correlation Details
| Immigrants from El Salvador Percentile | Sample Size | Wage/Income Gap |
[ 0.0% - 0.5% ] 0.094% | 160,113,489 | 27.0% |
[ 0.0% - 0.5% ] 0.32% | 73,860,454 | 24.7% |
[ 0.5% - 1.0% ] 0.53% | 29,326,863 | 25.3% |
[ 0.5% - 1.0% ] 0.75% | 18,409,000 | 24.1% |
[ 0.5% - 1.0% ] 0.96% | 15,228,130 | 24.7% |
[ 1.0% - 1.5% ] 1.16% | 10,024,337 | 23.1% |
[ 1.0% - 1.5% ] 1.39% | 8,386,911 | 22.9% |
[ 1.5% - 2.0% ] 1.60% | 5,663,270 | 20.2% |
[ 1.5% - 2.0% ] 1.82% | 4,182,598 | 22.3% |
[ 2.0% - 2.5% ] 2.02% | 2,818,173 | 23.4% |
[ 2.0% - 2.5% ] 2.24% | 2,872,242 | 24.2% |
[ 2.0% - 2.5% ] 2.47% | 2,192,748 | 24.1% |
[ 2.5% - 3.0% ] 2.70% | 1,846,200 | 21.1% |
[ 2.5% - 3.0% ] 2.85% | 3,612,163 | 21.8% |
[ 3.0% - 3.5% ] 3.11% | 1,222,363 | 24.3% |
[ 3.0% - 3.5% ] 3.30% | 1,086,033 | 24.1% |
[ 3.5% - 4.0% ] 3.52% | 1,058,232 | 22.9% |
[ 3.5% - 4.0% ] 3.76% | 871,186 | 21.0% |
[ 3.5% - 4.0% ] 3.97% | 632,860 | 19.2% |
[ 4.0% - 4.5% ] 4.19% | 509,294 | 23.3% |
[ 4.0% - 4.5% ] 4.35% | 4,433,557 | 17.4% |
[ 4.5% - 5.0% ] 4.62% | 676,745 | 25.9% |
[ 4.5% - 5.0% ] 4.87% | 603,964 | 18.1% |
[ 5.0% - 5.5% ] 5.07% | 598,720 | 22.4% |
[ 5.0% - 5.5% ] 5.25% | 298,366 | 21.3% |
[ 5.0% - 5.5% ] 5.47% | 696,623 | 21.5% |
[ 5.5% - 6.0% ] 5.69% | 376,170 | 17.0% |
[ 5.5% - 6.0% ] 5.94% | 217,826 | 16.8% |
[ 6.0% - 6.5% ] 6.11% | 246,494 | 12.4% |
[ 6.0% - 6.5% ] 6.35% | 150,230 | 12.1% |
[ 6.5% - 7.0% ] 6.53% | 461,239 | 24.3% |
[ 6.5% - 7.0% ] 6.76% | 398,482 | 19.7% |
[ 6.5% - 7.0% ] 6.98% | 103,069 | 27.3% |
[ 7.0% - 7.5% ] 7.17% | 171,099 | 22.4% |
[ 7.0% - 7.5% ] 7.37% | 291,831 | 24.9% |
[ 7.5% - 8.0% ] 7.62% | 242,166 | 20.9% |
[ 7.5% - 8.0% ] 7.89% | 84,623 | 23.7% |
[ 8.0% - 8.5% ] 8.07% | 109,881 | 30.8% |
[ 8.0% - 8.5% ] 8.26% | 367,396 | 21.0% |
[ 8.5% - 9.0% ] 8.53% | 339,140 | 17.8% |
[ 8.5% - 9.0% ] 8.71% | 164,080 | 23.1% |
[ 8.5% - 9.0% ] 8.98% | 101,128 | 25.0% |
[ 9.0% - 9.5% ] 9.13% | 155,953 | 30.4% |
[ 9.0% - 9.5% ] 9.32% | 326,786 | 21.9% |
[ 9.5% - 10.0% ] 9.59% | 95,999 | 26.6% |
[ 9.5% - 10.0% ] 9.82% | 137,981 | 36.9% |
[ 10.0% - 10.5% ] 10.05% | 103,022 | 24.1% |
[ 10.0% - 10.5% ] 10.25% | 33,408 | 33.6% |
[ 10.0% - 10.5% ] 10.37% | 64,890 | 12.2% |
[ 10.5% - 11.0% ] 10.59% | 114,601 | 21.5% |
[ 10.5% - 11.0% ] 10.85% | 9,431 | 33.9% |
[ 11.0% - 11.5% ] 11.12% | 25,324 | 31.0% |
[ 11.0% - 11.5% ] 11.32% | 201,194 | 23.3% |
[ 11.0% - 11.5% ] 11.49% | 44,814 | 24.1% |
[ 11.5% - 12.0% ] 11.84% | 32,191 | 14.2% |
[ 12.0% - 12.5% ] 12.16% | 59,604 | 30.7% |
[ 12.0% - 12.5% ] 12.30% | 91,938 | 13.0% |
[ 12.5% - 13.0% ] 12.84% | 126,295 | 15.6% |
[ 13.0% - 13.5% ] 13.01% | 85,124 | 16.2% |
[ 13.0% - 13.5% ] 13.19% | 75,956 | 24.0% |
[ 13.0% - 13.5% ] 13.40% | 120,534 | 19.0% |
[ 13.5% - 14.0% ] 13.69% | 22,966 | 2.8% |
[ 13.5% - 14.0% ] 13.80% | 32,061 | 30.8% |
[ 14.0% - 14.5% ] 14.26% | 2,118 | 4.9% |
[ 14.5% - 15.0% ] 14.64% | 85,941 | 34.1% |
[ 14.5% - 15.0% ] 14.97% | 154,449 | 13.2% |
[ 15.0% - 15.5% ] 15.14% | 766 | 39.6% |
[ 15.0% - 15.5% ] 15.36% | 34,625 | 24.2% |
[ 15.5% - 16.0% ] 16.00% | 3,325 | 14.6% |
[ 16.0% - 16.5% ] 16.32% | 15,127 | 35.5% |
[ 16.0% - 16.5% ] 16.40% | 16,944 | 16.6% |
[ 16.5% - 17.0% ] 16.63% | 6,947 | 26.3% |
[ 17.0% - 17.5% ] 17.32% | 6,218 | 0.18% |
[ 17.0% - 17.5% ] 17.42% | 3,851 | 25.8% |
[ 17.5% - 18.0% ] 17.85% | 24,325 | 28.2% |
[ 18.5% - 19.0% ] 18.59% | 84,133 | 16.8% |
[ 19.0% - 19.5% ] 19.10% | 9,031 | 24.8% |
[ 19.0% - 19.5% ] 19.20% | 7,094 | 8.8% |
[ 19.5% - 20.0% ] 19.59% | 1,751 | 36.7% |
[ 19.5% - 20.0% ] 19.89% | 10,563 | 37.1% |
[ 20.0% - 20.5% ] 20.12% | 18,080 | 32.8% |
[ 20.5% - 21.0% ] 20.62% | 50,387 | 23.5% |
[ 20.5% - 21.0% ] 20.87% | 35,908 | 23.7% |
[ 23.0% - 23.5% ] 23.33% | 14,736 | 39.3% |
[ 25.5% - 26.0% ] 25.98% | 14,367 | 39.4% |
[ 42.5% - 43.0% ] 42.98% | 114 | 30.5% |