Immigrants from Bahamas 1 or more Vehicles in Household

COMPARE

Immigrants from Bahamas
Race
Ancestry
AfghanAfricanAlaska NativeAlaskan AthabascanAlbanianAleutAlsatianAmericanApacheArabArapahoArgentineanArmenianAssyrian/Chaldean/SyriacAustralianAustrianBahamianBangladeshiBarbadianBasqueBelgianBelizeanBermudanBhutaneseBlackfeetBolivianBrazilianBritishBritish West IndianBulgarianBurmeseCajunCambodianCanadianCape VerdeanCarpatho RusynCelticCentral AmericanCentral American IndianCherokeeCheyenneChickasawChileanChineseChippewaChoctawColombianColvilleComancheCosta RicanCreeCreekCroatianCrowCubanCypriotCzechCzechoslovakianDanishDelawareDominicanDutchDutch West IndianEastern EuropeanEcuadorianEgyptianEnglishEstonianEthiopianEuropeanFijianFilipinoFinnishFrenchFrench American IndianFrench CanadianGermanGerman RussianGhanaianGreekGuamanian/ChamorroGuatemalanGuyaneseHaitianHmongHonduranHopiHoumaHungarianIcelanderIndian (Asian)IndonesianInupiatIranianIraqiIrishIroquoisIsraeliItalianJamaicanJapaneseJordanianKenyanKiowaKoreanLaotianLatvianLebaneseLiberianLithuanianLumbeeLuxembourgerMacedonianMalaysianMalteseMarshalleseMenomineeMexicanMexican American IndianMongolianMoroccanNative HawaiianNavajoNepaleseNew ZealanderNicaraguanNigerianNorthern EuropeanNorwegianOkinawanOsageOttawaPaiutePakistaniPalestinianPanamanianParaguayanPennsylvania GermanPeruvianPimaPolishPortuguesePotawatomiPuebloPuerto RicanPuget Sound SalishRomanianRussianSalvadoranSamoanScandinavianScotch-IrishScottishSeminoleSenegaleseSerbianShoshoneSierra LeoneanSiouxSlavicSlovakSloveneSomaliSouth AfricanSouth AmericanSouth American IndianSoviet UnionSpaniardSpanishSpanish AmericanSpanish American IndianSri LankanSubsaharan AfricanSudaneseSwedishSwissSyrianTaiwaneseThaiTlingit-HaidaTohono O'OdhamTonganTrinidadian and TobagonianTsimshianTurkishU.S. Virgin IslanderUgandanUkrainianUruguayanUteVenezuelanVietnameseWelshWest IndianYakamaYaquiYugoslavianYumanYup'ikZimbabwean
Immigration
NonimmigrantsImmigrantsAfghanistanAfricaAlbaniaArgentinaArmeniaAsiaAustraliaAustriaBahamasBangladeshBarbadosBelarusBelgiumBelizeBoliviaBosnia and HerzegovinaBrazilBulgariaBurma/MyanmarCabo VerdeCambodiaCameroonCanadaCaribbeanCentral AmericaChileChinaColombiaCongoCosta RicaCroatiaCubaCzechoslovakiaDenmarkDominicaDominican RepublicEastern AfricaEastern AsiaEastern EuropeEcuadorEgyptEl SalvadorEnglandEritreaEthiopiaEuropeFijiFranceGermanyGhanaGreeceGrenadaGuatemalaGuyanaHaitiHondurasHong KongHungaryIndiaIndonesiaIranIraqIrelandIsraelItalyJamaicaJapanJordanKazakhstanKenyaKoreaKuwaitLaosLatin AmericaLatviaLebanonLiberiaLithuaniaMalaysiaMexicoMicronesiaMiddle AfricaMoldovaMoroccoNepalNetherlandsNicaraguaNigeriaNorth AmericaNorth MacedoniaNorthern AfricaNorthern EuropeNorwayOceaniaPakistanPanamaPeruPhilippinesPolandPortugalRomaniaRussiaSaudi ArabiaScotlandSenegalSerbiaSierra LeoneSingaporeSomaliaSouth AfricaSouth AmericaSouth Central AsiaSouth Eastern AsiaSouthern EuropeSpainSri LankaSt. Vincent and the GrenadinesSudanSwedenSwitzerlandSyriaTaiwanThailandTrinidad and TobagoTurkeyUgandaUkraineUruguayUzbekistanVenezuelaVietnamWest IndiesWestern AfricaWestern AsiaWestern EuropeYemenZaireZimbabweAzores
Select to Compare
Race
Ancestry
AfghanAfricanAlaska NativeAlaskan AthabascanAlbanianAleutAlsatianAmericanApacheArabArapahoArgentineanArmenianAssyrian/Chaldean/SyriacAustralianAustrianBahamianBangladeshiBarbadianBasqueBelgianBelizeanBermudanBhutaneseBlackfeetBolivianBrazilianBritishBritish West IndianBulgarianBurmeseCajunCambodianCanadianCape VerdeanCarpatho RusynCelticCentral AmericanCentral American IndianCherokeeCheyenneChickasawChileanChineseChippewaChoctawColombianColvilleComancheCosta RicanCreeCreekCroatianCrowCubanCypriotCzechCzechoslovakianDanishDelawareDominicanDutchDutch West IndianEastern EuropeanEcuadorianEgyptianEnglishEstonianEthiopianEuropeanFijianFilipinoFinnishFrenchFrench American IndianFrench CanadianGermanGerman RussianGhanaianGreekGuamanian/ChamorroGuatemalanGuyaneseHaitianHmongHonduranHopiHoumaHungarianIcelanderIndian (Asian)IndonesianInupiatIranianIraqiIrishIroquoisIsraeliItalianJamaicanJapaneseJordanianKenyanKiowaKoreanLaotianLatvianLebaneseLiberianLithuanianLumbeeLuxembourgerMacedonianMalaysianMalteseMarshalleseMenomineeMexicanMexican American IndianMongolianMoroccanNative HawaiianNavajoNepaleseNew ZealanderNicaraguanNigerianNorthern EuropeanNorwegianOkinawanOsageOttawaPaiutePakistaniPalestinianPanamanianParaguayanPennsylvania GermanPeruvianPimaPolishPortuguesePotawatomiPuebloPuerto RicanPuget Sound SalishRomanianRussianSalvadoranSamoanScandinavianScotch-IrishScottishSeminoleSenegaleseSerbianShoshoneSierra LeoneanSiouxSlavicSlovakSloveneSomaliSouth AfricanSouth AmericanSouth American IndianSoviet UnionSpaniardSpanishSpanish AmericanSpanish American IndianSri LankanSubsaharan AfricanSudaneseSwedishSwissSyrianTaiwaneseThaiTlingit-HaidaTohono O'OdhamTonganTrinidadian and TobagonianTsimshianTurkishU.S. Virgin IslanderUgandanUkrainianUruguayanUteVenezuelanVietnameseWelshWest IndianYakamaYaquiYugoslavianYumanYup'ikZimbabwean
Immigration
NonimmigrantsImmigrantsAfghanistanAfricaAlbaniaArgentinaArmeniaAsiaAustraliaAustriaBangladeshBarbadosBelarusBelgiumBelizeBoliviaBosnia and HerzegovinaBrazilBulgariaBurma/MyanmarCabo VerdeCambodiaCameroonCanadaCaribbeanCentral AmericaChileChinaColombiaCongoCosta RicaCroatiaCubaCzechoslovakiaDenmarkDominicaDominican RepublicEastern AfricaEastern AsiaEastern EuropeEcuadorEgyptEl SalvadorEnglandEritreaEthiopiaEuropeFijiFranceGermanyGhanaGreeceGrenadaGuatemalaGuyanaHaitiHondurasHong KongHungaryIndiaIndonesiaIranIraqIrelandIsraelItalyJamaicaJapanJordanKazakhstanKenyaKoreaKuwaitLaosLatin AmericaLatviaLebanonLiberiaLithuaniaMalaysiaMexicoMicronesiaMiddle AfricaMoldovaMoroccoNepalNetherlandsNicaraguaNigeriaNorth AmericaNorth MacedoniaNorthern AfricaNorthern EuropeNorwayOceaniaPakistanPanamaPeruPhilippinesPolandPortugalRomaniaRussiaSaudi ArabiaScotlandSenegalSerbiaSierra LeoneSingaporeSomaliaSouth AfricaSouth AmericaSouth Central AsiaSouth Eastern AsiaSouthern EuropeSpainSri LankaSt. Vincent and the GrenadinesSudanSwedenSwitzerlandSyriaTaiwanThailandTrinidad and TobagoTurkeyUgandaUkraineUruguayUzbekistanVenezuelaVietnamWest IndiesWestern AfricaWestern AsiaWestern EuropeYemenZaireZimbabweAzores
1 or more Vehicles in Household
Income
Poverty
Unemployment
Labor Participation
Family Structure
Vehicle Availability
Education Level
Disability

Immigrants from Bahamas 1 or more Vehicles in Household
Excellent

90.2%
1+ VEHICLES AVAILABLE
81.5/ 100
METRIC RATING
143rd/ 347
METRIC RANK

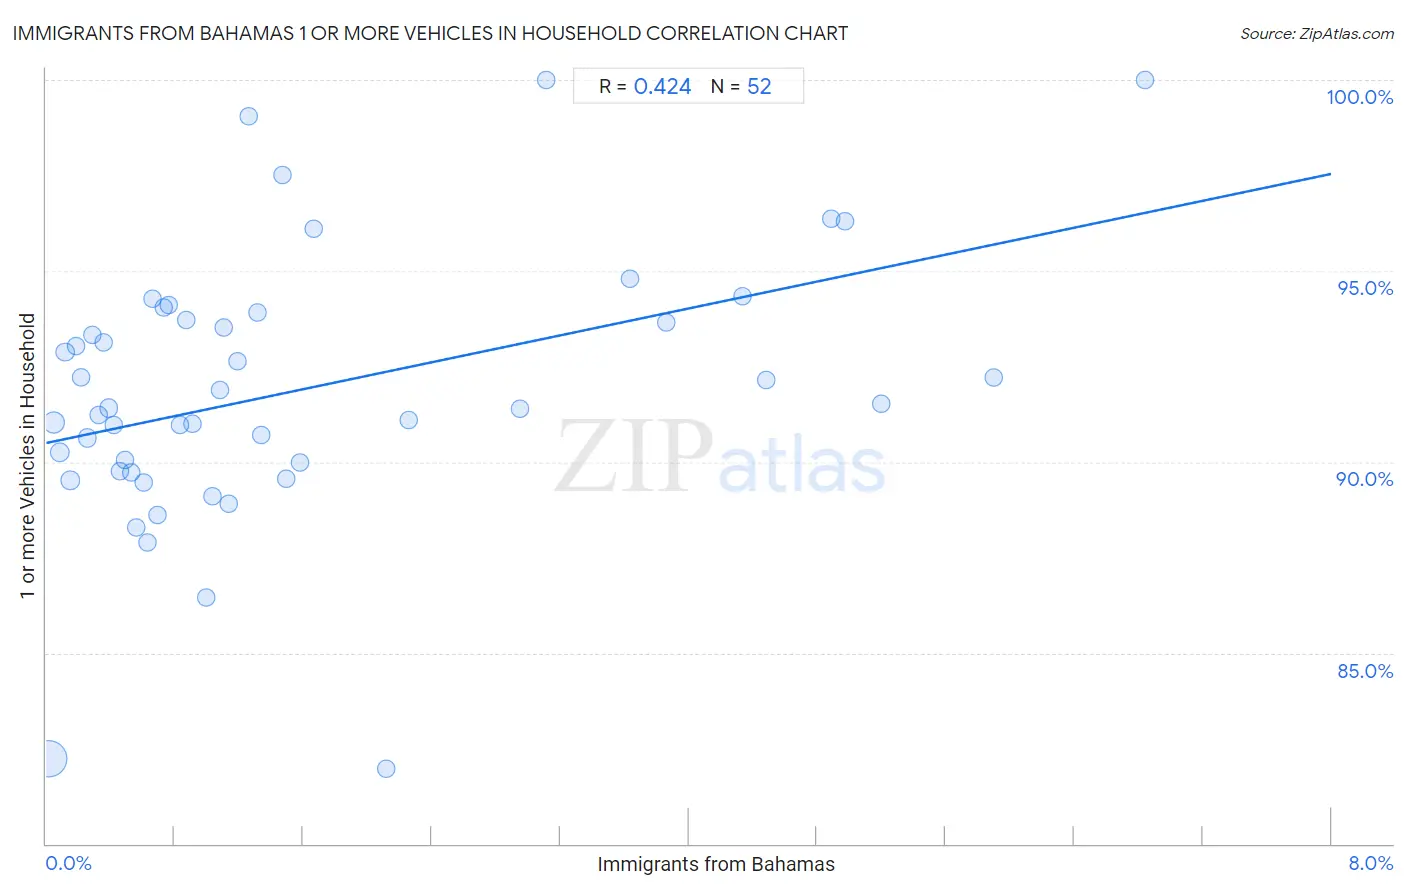
Immigrants from Bahamas 1 or more Vehicles in Household Correlation Chart

The statistical analysis conducted on geographies consisting of 104,615,512 people shows a moderate positive correlation between the proportion of Immigrants from Bahamas and percentage of households with 1 or more vehicles available in the United States with a correlation coefficient (R) of 0.424 and weighted average of 90.2%. On average, for every 1% (one percent) increase in Immigrants from Bahamas within a typical geography, there is an increase of 0.88% in percentage of households with 1 or more vehicles available.
Immigrants from Bahamas 1 or more Vehicles in Household
It is essential to understand that the correlation between the percentage of Immigrants from Bahamas and percentage of households with 1 or more vehicles available does not imply a direct cause-and-effect relationship. It remains uncertain whether the presence of Immigrants from Bahamas influences an upward or downward trend in the level of percentage of households with 1 or more vehicles available within an area, or if Immigrants from Bahamas simply ended up residing in those areas with higher or lower levels of percentage of households with 1 or more vehicles available due to other factors.

Demographics Similar to Immigrants from Bahamas by 1 or more Vehicles in Household

In terms of 1 or more vehicles in household, the demographic groups most similar to Immigrants from Bahamas are Immigrants from Zimbabwe (90.2%, a difference of 0.0%), Sioux (90.2%, a difference of 0.010%), Bahamian (90.2%, a difference of 0.030%), Immigrants from Moldova (90.2%, a difference of 0.040%), and Immigrants from Lithuania (90.2%, a difference of 0.040%).
DemographicsRating | Rank1 or more Vehicles in Household
Hungarians
86.5
/100
|
#136
Excellent
90.3%
Latvians
86.3
/100
|
#137
Excellent
90.3%
Syrians
86.3
/100
|
#138
Excellent
90.3%
Estonians
85.6
/100
|
#139
Excellent
90.3%
Sudanese
85.2
/100
|
#140
Excellent
90.3%
Immigrants from Moldova
83.1
/100
|
#141
Excellent
90.2%
Immigrants from Lithuania
83.0
/100
|
#142
Excellent
90.2%
Immigrants from Bahamas
81.5
/100
|
#143
Excellent
90.2%
Immigrants from Zimbabwe
81.5
/100
|
#144
Excellent
90.2%
Sioux
81.3
/100
|
#145
Excellent
90.2%
Bahamians
80.5
/100
|
#146
Excellent
90.2%
Chileans
79.8
/100
|
#147
Good
90.2%
Immigrants from Eastern Africa
78.2
/100
|
#148
Good
90.1%
Immigrants from Nicaragua
76.7
/100
|
#149
Good
90.1%
Immigrants from Micronesia
75.9
/100
|
#150
Good
90.1%

Immigrants from Bahamas 1 or more Vehicles in Household Correlation Summary

MeasurementImmigrants from Bahamas Data1 or more Vehicles in Household Data
Minimum0.012%82.0%
Maximum6.8%100.0%
Range6.8%18.0%
Mean1.6%91.9%
Median0.95%91.5%
Interquartile 25% (IQ1)0.44%89.9%
Interquartile 75% (IQ3)1.9%93.8%
Interquartile Range (IQR)1.4%3.9%
Standard Deviation (Sample)1.7%3.6%
Standard Deviation (Population)1.7%3.5%

Correlation Details

Immigrants from Bahamas PercentileSample Size1 or more Vehicles in Household
[
0.0%
-
0.5%
]
0.012%
70,189,09482.2%
[
0.0%
-
0.5%
]
0.049%
14,047,26191.0%
[
0.0%
-
0.5%
]
0.085%
6,089,08290.3%
[
0.0%
-
0.5%
]
0.12%
3,294,00892.9%
[
0.0%
-
0.5%
]
0.15%
2,364,12989.5%
[
0.0%
-
0.5%
]
0.19%
1,396,98593.0%
[
0.0%
-
0.5%
]
0.22%
1,218,09892.2%
[
0.0%
-
0.5%
]
0.26%
1,253,98390.6%
[
0.0%
-
0.5%
]
0.29%
866,85193.3%
[
0.0%
-
0.5%
]
0.33%
496,65391.2%
[
0.0%
-
0.5%
]
0.36%
705,55193.1%
[
0.0%
-
0.5%
]
0.39%
321,09791.4%
[
0.0%
-
0.5%
]
0.42%
110,87391.0%
[
0.0%
-
0.5%
]
0.46%
393,86289.8%
[
0.0%
-
0.5%
]
0.49%
137,51290.1%
[
0.5%
-
1.0%
]
0.53%
197,53689.7%
[
0.5%
-
1.0%
]
0.56%
97,28888.3%
[
0.5%
-
1.0%
]
0.61%
123,57289.5%
[
0.5%
-
1.0%
]
0.63%
170,22387.9%
[
0.5%
-
1.0%
]
0.66%
17,47694.3%
[
0.5%
-
1.0%
]
0.69%
92,30788.6%
[
0.5%
-
1.0%
]
0.73%
135,42394.1%
[
0.5%
-
1.0%
]
0.76%
65,20294.1%
[
0.5%
-
1.0%
]
0.83%
116,58691.0%
[
0.5%
-
1.0%
]
0.87%
47,83893.7%
[
0.5%
-
1.0%
]
0.91%
43,52991.0%
[
0.5%
-
1.0%
]
0.99%
62,23286.4%
[
1.0%
-
1.5%
]
1.03%
104,82489.1%
[
1.0%
-
1.5%
]
1.08%
159,94491.9%
[
1.0%
-
1.5%
]
1.10%
33,96693.5%
[
1.0%
-
1.5%
]
1.13%
2,38188.9%
[
1.0%
-
1.5%
]
1.19%
47,47092.6%
[
1.0%
-
1.5%
]
1.26%
12,08099.1%
[
1.0%
-
1.5%
]
1.31%
5,17493.9%
[
1.0%
-
1.5%
]
1.34%
45,31290.7%
[
1.0%
-
1.5%
]
1.47%
10,20897.5%
[
1.0%
-
1.5%
]
1.50%
14,55889.6%
[
1.5%
-
2.0%
]
1.58%
43,09990.0%
[
1.5%
-
2.0%
]
1.66%
8,24496.1%
[
2.0%
-
2.5%
]
2.11%
2,79182.0%
[
2.0%
-
2.5%
]
2.26%
2,34991.1%
[
2.5%
-
3.0%
]
2.95%
84791.4%
[
3.0%
-
3.5%
]
3.11%
7,385100.0%
[
3.5%
-
4.0%
]
3.64%
9,67794.8%
[
3.5%
-
4.0%
]
3.86%
18,48793.6%
[
4.0%
-
4.5%
]
4.34%
8,11894.3%
[
4.0%
-
4.5%
]
4.48%
15,73592.1%
[
4.5%
-
5.0%
]
4.89%
2,19096.4%
[
4.5%
-
5.0%
]
4.97%
2,15196.3%
[
5.0%
-
5.5%
]
5.19%
1,54091.5%
[
5.5%
-
6.0%
]
5.90%
30592.2%
[
6.5%
-
7.0%
]
6.84%
2,426100.0%