Immigrants from Bahamas 4 or more Vehicles in Household

COMPARE

Immigrants from Bahamas
Race
Ancestry
AfghanAfricanAlaska NativeAlaskan AthabascanAlbanianAleutAlsatianAmericanApacheArabArapahoArgentineanArmenianAssyrian/Chaldean/SyriacAustralianAustrianBahamianBangladeshiBarbadianBasqueBelgianBelizeanBermudanBhutaneseBlackfeetBolivianBrazilianBritishBritish West IndianBulgarianBurmeseCajunCambodianCanadianCape VerdeanCarpatho RusynCelticCentral AmericanCentral American IndianCherokeeCheyenneChickasawChileanChineseChippewaChoctawColombianColvilleComancheCosta RicanCreeCreekCroatianCrowCubanCypriotCzechCzechoslovakianDanishDelawareDominicanDutchDutch West IndianEastern EuropeanEcuadorianEgyptianEnglishEstonianEthiopianEuropeanFijianFilipinoFinnishFrenchFrench American IndianFrench CanadianGermanGerman RussianGhanaianGreekGuamanian/ChamorroGuatemalanGuyaneseHaitianHmongHonduranHopiHoumaHungarianIcelanderIndian (Asian)IndonesianInupiatIranianIraqiIrishIroquoisIsraeliItalianJamaicanJapaneseJordanianKenyanKiowaKoreanLaotianLatvianLebaneseLiberianLithuanianLumbeeLuxembourgerMacedonianMalaysianMalteseMarshalleseMenomineeMexicanMexican American IndianMongolianMoroccanNative HawaiianNavajoNepaleseNew ZealanderNicaraguanNigerianNorthern EuropeanNorwegianOkinawanOsageOttawaPaiutePakistaniPalestinianPanamanianParaguayanPennsylvania GermanPeruvianPimaPolishPortuguesePotawatomiPuebloPuerto RicanPuget Sound SalishRomanianRussianSalvadoranSamoanScandinavianScotch-IrishScottishSeminoleSenegaleseSerbianShoshoneSierra LeoneanSiouxSlavicSlovakSloveneSomaliSouth AfricanSouth AmericanSouth American IndianSoviet UnionSpaniardSpanishSpanish AmericanSpanish American IndianSri LankanSubsaharan AfricanSudaneseSwedishSwissSyrianTaiwaneseThaiTlingit-HaidaTohono O'OdhamTonganTrinidadian and TobagonianTsimshianTurkishU.S. Virgin IslanderUgandanUkrainianUruguayanUteVenezuelanVietnameseWelshWest IndianYakamaYaquiYugoslavianYumanYup'ikZimbabwean
Immigration
NonimmigrantsImmigrantsAfghanistanAfricaAlbaniaArgentinaArmeniaAsiaAustraliaAustriaBahamasBangladeshBarbadosBelarusBelgiumBelizeBoliviaBosnia and HerzegovinaBrazilBulgariaBurma/MyanmarCabo VerdeCambodiaCameroonCanadaCaribbeanCentral AmericaChileChinaColombiaCongoCosta RicaCroatiaCubaCzechoslovakiaDenmarkDominicaDominican RepublicEastern AfricaEastern AsiaEastern EuropeEcuadorEgyptEl SalvadorEnglandEritreaEthiopiaEuropeFijiFranceGermanyGhanaGreeceGrenadaGuatemalaGuyanaHaitiHondurasHong KongHungaryIndiaIndonesiaIranIraqIrelandIsraelItalyJamaicaJapanJordanKazakhstanKenyaKoreaKuwaitLaosLatin AmericaLatviaLebanonLiberiaLithuaniaMalaysiaMexicoMicronesiaMiddle AfricaMoldovaMoroccoNepalNetherlandsNicaraguaNigeriaNorth AmericaNorth MacedoniaNorthern AfricaNorthern EuropeNorwayOceaniaPakistanPanamaPeruPhilippinesPolandPortugalRomaniaRussiaSaudi ArabiaScotlandSenegalSerbiaSierra LeoneSingaporeSomaliaSouth AfricaSouth AmericaSouth Central AsiaSouth Eastern AsiaSouthern EuropeSpainSri LankaSt. Vincent and the GrenadinesSudanSwedenSwitzerlandSyriaTaiwanThailandTrinidad and TobagoTurkeyUgandaUkraineUruguayUzbekistanVenezuelaVietnamWest IndiesWestern AfricaWestern AsiaWestern EuropeYemenZaireZimbabweAzores
Select to Compare
Race
Ancestry
AfghanAfricanAlaska NativeAlaskan AthabascanAlbanianAleutAlsatianAmericanApacheArabArapahoArgentineanArmenianAssyrian/Chaldean/SyriacAustralianAustrianBahamianBangladeshiBarbadianBasqueBelgianBelizeanBermudanBhutaneseBlackfeetBolivianBrazilianBritishBritish West IndianBulgarianBurmeseCajunCambodianCanadianCape VerdeanCarpatho RusynCelticCentral AmericanCentral American IndianCherokeeCheyenneChickasawChileanChineseChippewaChoctawColombianColvilleComancheCosta RicanCreeCreekCroatianCrowCubanCypriotCzechCzechoslovakianDanishDelawareDominicanDutchDutch West IndianEastern EuropeanEcuadorianEgyptianEnglishEstonianEthiopianEuropeanFijianFilipinoFinnishFrenchFrench American IndianFrench CanadianGermanGerman RussianGhanaianGreekGuamanian/ChamorroGuatemalanGuyaneseHaitianHmongHonduranHopiHoumaHungarianIcelanderIndian (Asian)IndonesianInupiatIranianIraqiIrishIroquoisIsraeliItalianJamaicanJapaneseJordanianKenyanKiowaKoreanLaotianLatvianLebaneseLiberianLithuanianLumbeeLuxembourgerMacedonianMalaysianMalteseMarshalleseMenomineeMexicanMexican American IndianMongolianMoroccanNative HawaiianNavajoNepaleseNew ZealanderNicaraguanNigerianNorthern EuropeanNorwegianOkinawanOsageOttawaPaiutePakistaniPalestinianPanamanianParaguayanPennsylvania GermanPeruvianPimaPolishPortuguesePotawatomiPuebloPuerto RicanPuget Sound SalishRomanianRussianSalvadoranSamoanScandinavianScotch-IrishScottishSeminoleSenegaleseSerbianShoshoneSierra LeoneanSiouxSlavicSlovakSloveneSomaliSouth AfricanSouth AmericanSouth American IndianSoviet UnionSpaniardSpanishSpanish AmericanSpanish American IndianSri LankanSubsaharan AfricanSudaneseSwedishSwissSyrianTaiwaneseThaiTlingit-HaidaTohono O'OdhamTonganTrinidadian and TobagonianTsimshianTurkishU.S. Virgin IslanderUgandanUkrainianUruguayanUteVenezuelanVietnameseWelshWest IndianYakamaYaquiYugoslavianYumanYup'ikZimbabwean
Immigration
NonimmigrantsImmigrantsAfghanistanAfricaAlbaniaArgentinaArmeniaAsiaAustraliaAustriaBangladeshBarbadosBelarusBelgiumBelizeBoliviaBosnia and HerzegovinaBrazilBulgariaBurma/MyanmarCabo VerdeCambodiaCameroonCanadaCaribbeanCentral AmericaChileChinaColombiaCongoCosta RicaCroatiaCubaCzechoslovakiaDenmarkDominicaDominican RepublicEastern AfricaEastern AsiaEastern EuropeEcuadorEgyptEl SalvadorEnglandEritreaEthiopiaEuropeFijiFranceGermanyGhanaGreeceGrenadaGuatemalaGuyanaHaitiHondurasHong KongHungaryIndiaIndonesiaIranIraqIrelandIsraelItalyJamaicaJapanJordanKazakhstanKenyaKoreaKuwaitLaosLatin AmericaLatviaLebanonLiberiaLithuaniaMalaysiaMexicoMicronesiaMiddle AfricaMoldovaMoroccoNepalNetherlandsNicaraguaNigeriaNorth AmericaNorth MacedoniaNorthern AfricaNorthern EuropeNorwayOceaniaPakistanPanamaPeruPhilippinesPolandPortugalRomaniaRussiaSaudi ArabiaScotlandSenegalSerbiaSierra LeoneSingaporeSomaliaSouth AfricaSouth AmericaSouth Central AsiaSouth Eastern AsiaSouthern EuropeSpainSri LankaSt. Vincent and the GrenadinesSudanSwedenSwitzerlandSyriaTaiwanThailandTrinidad and TobagoTurkeyUgandaUkraineUruguayUzbekistanVenezuelaVietnamWest IndiesWestern AfricaWestern AsiaWestern EuropeYemenZaireZimbabweAzores
4 or more Vehicles in Household
Income
Poverty
Unemployment
Labor Participation
Family Structure
Vehicle Availability
Education Level
Disability

Immigrants from Bahamas 4 or more Vehicles in Household
Tragic

5.3%
4+ VEHICLES AVAILABLE
0.1/ 100
METRIC RATING
291st/ 347
METRIC RANK

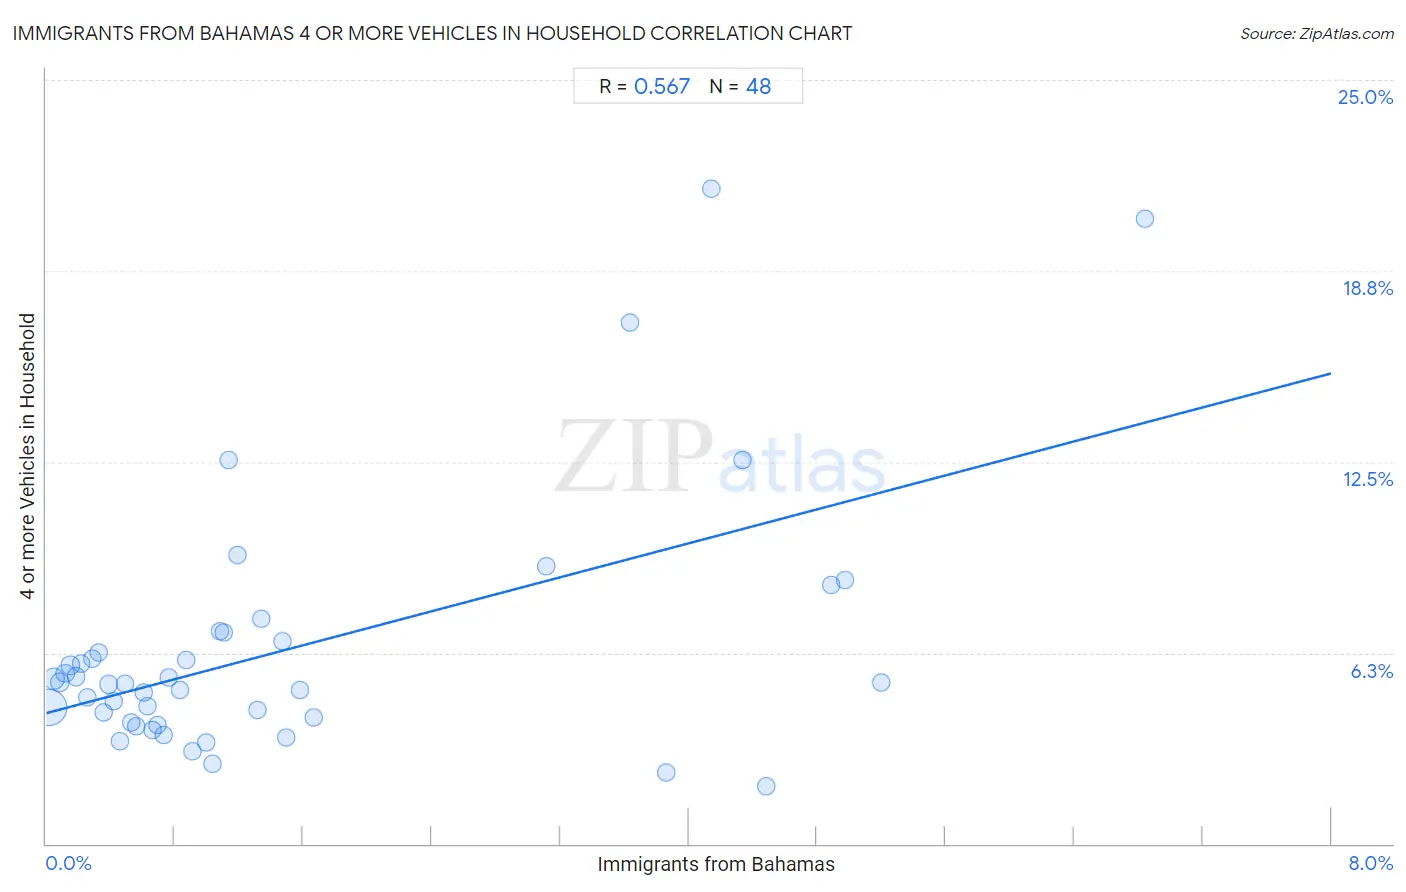
Immigrants from Bahamas 4 or more Vehicles in Household Correlation Chart

The statistical analysis conducted on geographies consisting of 104,355,564 people shows a substantial positive correlation between the proportion of Immigrants from Bahamas and percentage of households with 4 or more vehicles available in the United States with a correlation coefficient (R) of 0.567 and weighted average of 5.3%. On average, for every 1% (one percent) increase in Immigrants from Bahamas within a typical geography, there is an increase of 1.4% in percentage of households with 4 or more vehicles available.
Immigrants from Bahamas 4 or more Vehicles in Household
It is essential to understand that the correlation between the percentage of Immigrants from Bahamas and percentage of households with 4 or more vehicles available does not imply a direct cause-and-effect relationship. It remains uncertain whether the presence of Immigrants from Bahamas influences an upward or downward trend in the level of percentage of households with 4 or more vehicles available within an area, or if Immigrants from Bahamas simply ended up residing in those areas with higher or lower levels of percentage of households with 4 or more vehicles available due to other factors.

Demographics Similar to Immigrants from Bahamas by 4 or more Vehicles in Household

In terms of 4 or more vehicles in household, the demographic groups most similar to Immigrants from Bahamas are Liberian (5.3%, a difference of 0.10%), Immigrants from Congo (5.2%, a difference of 0.13%), Ghanaian (5.2%, a difference of 0.19%), Immigrants from Brazil (5.2%, a difference of 0.30%), and Israeli (5.2%, a difference of 0.48%).
DemographicsRating | Rank4 or more Vehicles in Household
Brazilians
0.3
/100
|
#284
Tragic
5.4%
Immigrants from Liberia
0.2
/100
|
#285
Tragic
5.4%
Immigrants from Colombia
0.2
/100
|
#286
Tragic
5.4%
Immigrants from Croatia
0.2
/100
|
#287
Tragic
5.4%
Venezuelans
0.2
/100
|
#288
Tragic
5.3%
Immigrants from Bosnia and Herzegovina
0.2
/100
|
#289
Tragic
5.3%
Immigrants from Russia
0.2
/100
|
#290
Tragic
5.3%
Immigrants from Bahamas
0.1
/100
|
#291
Tragic
5.3%
Liberians
0.1
/100
|
#292
Tragic
5.3%
Immigrants from Congo
0.1
/100
|
#293
Tragic
5.2%
Ghanaians
0.1
/100
|
#294
Tragic
5.2%
Immigrants from Brazil
0.1
/100
|
#295
Tragic
5.2%
Israelis
0.1
/100
|
#296
Tragic
5.2%
Immigrants from Venezuela
0.1
/100
|
#297
Tragic
5.2%
Immigrants from South America
0.1
/100
|
#298
Tragic
5.2%

Immigrants from Bahamas 4 or more Vehicles in Household Correlation Summary

MeasurementImmigrants from Bahamas Data4 or more Vehicles in Household Data
Minimum0.012%1.9%
Maximum6.8%21.5%
Range6.8%19.6%
Mean1.5%6.4%
Median0.85%5.3%
Interquartile 25% (IQ1)0.41%4.1%
Interquartile 75% (IQ3)1.5%6.8%
Interquartile Range (IQR)1.1%2.7%
Standard Deviation (Sample)1.7%4.1%
Standard Deviation (Population)1.7%4.1%

Correlation Details

Immigrants from Bahamas PercentileSample Size4 or more Vehicles in Household
[
0.0%
-
0.5%
]
0.012%
70,034,6424.5%
[
0.0%
-
0.5%
]
0.049%
14,030,1255.4%
[
0.0%
-
0.5%
]
0.085%
6,089,0825.3%
[
0.0%
-
0.5%
]
0.12%
3,287,6505.6%
[
0.0%
-
0.5%
]
0.15%
2,356,1005.8%
[
0.0%
-
0.5%
]
0.19%
1,392,0005.5%
[
0.0%
-
0.5%
]
0.22%
1,218,0985.9%
[
0.0%
-
0.5%
]
0.26%
1,253,9834.8%
[
0.0%
-
0.5%
]
0.29%
866,8516.1%
[
0.0%
-
0.5%
]
0.33%
449,5406.3%
[
0.0%
-
0.5%
]
0.36%
705,5514.3%
[
0.0%
-
0.5%
]
0.39%
318,3565.2%
[
0.0%
-
0.5%
]
0.42%
110,8734.7%
[
0.0%
-
0.5%
]
0.46%
393,8623.4%
[
0.0%
-
0.5%
]
0.49%
135,0365.2%
[
0.5%
-
1.0%
]
0.53%
197,5364.0%
[
0.5%
-
1.0%
]
0.56%
97,2883.9%
[
0.5%
-
1.0%
]
0.61%
123,5725.0%
[
0.5%
-
1.0%
]
0.63%
170,2234.5%
[
0.5%
-
1.0%
]
0.66%
17,4763.7%
[
0.5%
-
1.0%
]
0.69%
92,3073.9%
[
0.5%
-
1.0%
]
0.73%
135,4233.6%
[
0.5%
-
1.0%
]
0.76%
65,2025.4%
[
0.5%
-
1.0%
]
0.83%
116,5865.0%
[
0.5%
-
1.0%
]
0.87%
47,8386.0%
[
0.5%
-
1.0%
]
0.91%
43,5293.0%
[
0.5%
-
1.0%
]
0.99%
62,2323.3%
[
1.0%
-
1.5%
]
1.03%
104,8242.6%
[
1.0%
-
1.5%
]
1.08%
159,9447.0%
[
1.0%
-
1.5%
]
1.10%
33,9666.9%
[
1.0%
-
1.5%
]
1.13%
2,38112.6%
[
1.0%
-
1.5%
]
1.19%
47,4709.4%
[
1.0%
-
1.5%
]
1.31%
5,1744.4%
[
1.0%
-
1.5%
]
1.34%
45,3127.4%
[
1.0%
-
1.5%
]
1.47%
10,2086.6%
[
1.0%
-
1.5%
]
1.50%
14,5583.5%
[
1.5%
-
2.0%
]
1.58%
43,0995.0%
[
1.5%
-
2.0%
]
1.66%
8,2444.1%
[
3.0%
-
3.5%
]
3.11%
7,3859.1%
[
3.5%
-
4.0%
]
3.64%
9,67717.1%
[
3.5%
-
4.0%
]
3.86%
18,4872.3%
[
4.0%
-
4.5%
]
4.14%
1,71421.5%
[
4.0%
-
4.5%
]
4.34%
8,11812.6%
[
4.0%
-
4.5%
]
4.48%
15,7351.9%
[
4.5%
-
5.0%
]
4.89%
2,1908.5%
[
4.5%
-
5.0%
]
4.97%
2,1518.6%
[
5.0%
-
5.5%
]
5.19%
1,5405.3%
[
6.5%
-
7.0%
]
6.84%
2,42620.5%