Immigrants from Bahamas Wage/Income Gap

COMPARE

Immigrants from Bahamas
Race
Ancestry
AfghanAfricanAlaska NativeAlaskan AthabascanAlbanianAleutAlsatianAmericanApacheArabArapahoArgentineanArmenianAssyrian/Chaldean/SyriacAustralianAustrianBahamianBangladeshiBarbadianBasqueBelgianBelizeanBermudanBhutaneseBlackfeetBolivianBrazilianBritishBritish West IndianBulgarianBurmeseCajunCambodianCanadianCape VerdeanCarpatho RusynCelticCentral AmericanCentral American IndianCherokeeCheyenneChickasawChileanChineseChippewaChoctawColombianColvilleComancheCosta RicanCreeCreekCroatianCrowCubanCypriotCzechCzechoslovakianDanishDelawareDominicanDutchDutch West IndianEastern EuropeanEcuadorianEgyptianEnglishEstonianEthiopianEuropeanFijianFilipinoFinnishFrenchFrench American IndianFrench CanadianGermanGerman RussianGhanaianGreekGuamanian/ChamorroGuatemalanGuyaneseHaitianHmongHonduranHopiHoumaHungarianIcelanderIndian (Asian)IndonesianInupiatIranianIraqiIrishIroquoisIsraeliItalianJamaicanJapaneseJordanianKenyanKiowaKoreanLaotianLatvianLebaneseLiberianLithuanianLumbeeLuxembourgerMacedonianMalaysianMalteseMarshalleseMenomineeMexicanMexican American IndianMongolianMoroccanNative HawaiianNavajoNepaleseNew ZealanderNicaraguanNigerianNorthern EuropeanNorwegianOkinawanOsageOttawaPaiutePakistaniPalestinianPanamanianParaguayanPennsylvania GermanPeruvianPimaPolishPortuguesePotawatomiPuebloPuerto RicanPuget Sound SalishRomanianRussianSalvadoranSamoanScandinavianScotch-IrishScottishSeminoleSenegaleseSerbianShoshoneSierra LeoneanSiouxSlavicSlovakSloveneSomaliSouth AfricanSouth AmericanSouth American IndianSoviet UnionSpaniardSpanishSpanish AmericanSpanish American IndianSri LankanSubsaharan AfricanSudaneseSwedishSwissSyrianTaiwaneseThaiTlingit-HaidaTohono O'OdhamTonganTrinidadian and TobagonianTsimshianTurkishU.S. Virgin IslanderUgandanUkrainianUruguayanUteVenezuelanVietnameseWelshWest IndianYakamaYaquiYugoslavianYumanYup'ikZimbabwean
Immigration
NonimmigrantsImmigrantsAfghanistanAfricaAlbaniaArgentinaArmeniaAsiaAustraliaAustriaBahamasBangladeshBarbadosBelarusBelgiumBelizeBoliviaBosnia and HerzegovinaBrazilBulgariaBurma/MyanmarCabo VerdeCambodiaCameroonCanadaCaribbeanCentral AmericaChileChinaColombiaCongoCosta RicaCroatiaCubaCzechoslovakiaDenmarkDominicaDominican RepublicEastern AfricaEastern AsiaEastern EuropeEcuadorEgyptEl SalvadorEnglandEritreaEthiopiaEuropeFijiFranceGermanyGhanaGreeceGrenadaGuatemalaGuyanaHaitiHondurasHong KongHungaryIndiaIndonesiaIranIraqIrelandIsraelItalyJamaicaJapanJordanKazakhstanKenyaKoreaKuwaitLaosLatin AmericaLatviaLebanonLiberiaLithuaniaMalaysiaMexicoMicronesiaMiddle AfricaMoldovaMoroccoNepalNetherlandsNicaraguaNigeriaNorth AmericaNorth MacedoniaNorthern AfricaNorthern EuropeNorwayOceaniaPakistanPanamaPeruPhilippinesPolandPortugalRomaniaRussiaSaudi ArabiaScotlandSenegalSerbiaSierra LeoneSingaporeSomaliaSouth AfricaSouth AmericaSouth Central AsiaSouth Eastern AsiaSouthern EuropeSpainSri LankaSt. Vincent and the GrenadinesSudanSwedenSwitzerlandSyriaTaiwanThailandTrinidad and TobagoTurkeyUgandaUkraineUruguayUzbekistanVenezuelaVietnamWest IndiesWestern AfricaWestern AsiaWestern EuropeYemenZaireZimbabweAzores
Select to Compare
Race
Ancestry
AfghanAfricanAlaska NativeAlaskan AthabascanAlbanianAleutAlsatianAmericanApacheArabArapahoArgentineanArmenianAssyrian/Chaldean/SyriacAustralianAustrianBahamianBangladeshiBarbadianBasqueBelgianBelizeanBermudanBhutaneseBlackfeetBolivianBrazilianBritishBritish West IndianBulgarianBurmeseCajunCambodianCanadianCape VerdeanCarpatho RusynCelticCentral AmericanCentral American IndianCherokeeCheyenneChickasawChileanChineseChippewaChoctawColombianColvilleComancheCosta RicanCreeCreekCroatianCrowCubanCypriotCzechCzechoslovakianDanishDelawareDominicanDutchDutch West IndianEastern EuropeanEcuadorianEgyptianEnglishEstonianEthiopianEuropeanFijianFilipinoFinnishFrenchFrench American IndianFrench CanadianGermanGerman RussianGhanaianGreekGuamanian/ChamorroGuatemalanGuyaneseHaitianHmongHonduranHopiHoumaHungarianIcelanderIndian (Asian)IndonesianInupiatIranianIraqiIrishIroquoisIsraeliItalianJamaicanJapaneseJordanianKenyanKiowaKoreanLaotianLatvianLebaneseLiberianLithuanianLumbeeLuxembourgerMacedonianMalaysianMalteseMarshalleseMenomineeMexicanMexican American IndianMongolianMoroccanNative HawaiianNavajoNepaleseNew ZealanderNicaraguanNigerianNorthern EuropeanNorwegianOkinawanOsageOttawaPaiutePakistaniPalestinianPanamanianParaguayanPennsylvania GermanPeruvianPimaPolishPortuguesePotawatomiPuebloPuerto RicanPuget Sound SalishRomanianRussianSalvadoranSamoanScandinavianScotch-IrishScottishSeminoleSenegaleseSerbianShoshoneSierra LeoneanSiouxSlavicSlovakSloveneSomaliSouth AfricanSouth AmericanSouth American IndianSoviet UnionSpaniardSpanishSpanish AmericanSpanish American IndianSri LankanSubsaharan AfricanSudaneseSwedishSwissSyrianTaiwaneseThaiTlingit-HaidaTohono O'OdhamTonganTrinidadian and TobagonianTsimshianTurkishU.S. Virgin IslanderUgandanUkrainianUruguayanUteVenezuelanVietnameseWelshWest IndianYakamaYaquiYugoslavianYumanYup'ikZimbabwean
Immigration
NonimmigrantsImmigrantsAfghanistanAfricaAlbaniaArgentinaArmeniaAsiaAustraliaAustriaBangladeshBarbadosBelarusBelgiumBelizeBoliviaBosnia and HerzegovinaBrazilBulgariaBurma/MyanmarCabo VerdeCambodiaCameroonCanadaCaribbeanCentral AmericaChileChinaColombiaCongoCosta RicaCroatiaCubaCzechoslovakiaDenmarkDominicaDominican RepublicEastern AfricaEastern AsiaEastern EuropeEcuadorEgyptEl SalvadorEnglandEritreaEthiopiaEuropeFijiFranceGermanyGhanaGreeceGrenadaGuatemalaGuyanaHaitiHondurasHong KongHungaryIndiaIndonesiaIranIraqIrelandIsraelItalyJamaicaJapanJordanKazakhstanKenyaKoreaKuwaitLaosLatin AmericaLatviaLebanonLiberiaLithuaniaMalaysiaMexicoMicronesiaMiddle AfricaMoldovaMoroccoNepalNetherlandsNicaraguaNigeriaNorth AmericaNorth MacedoniaNorthern AfricaNorthern EuropeNorwayOceaniaPakistanPanamaPeruPhilippinesPolandPortugalRomaniaRussiaSaudi ArabiaScotlandSenegalSerbiaSierra LeoneSingaporeSomaliaSouth AfricaSouth AmericaSouth Central AsiaSouth Eastern AsiaSouthern EuropeSpainSri LankaSt. Vincent and the GrenadinesSudanSwedenSwitzerlandSyriaTaiwanThailandTrinidad and TobagoTurkeyUgandaUkraineUruguayUzbekistanVenezuelaVietnamWest IndiesWestern AfricaWestern AsiaWestern EuropeYemenZaireZimbabweAzores
Wage/Income Gap
Income
Poverty
Unemployment
Labor Participation
Family Structure
Vehicle Availability
Education Level
Disability

Immigrants from Bahamas Wage/Income Gap
Exceptional

21.1%
WAGE/INCOME GAP
100.0/ 100
METRIC RATING
33rd/ 347
METRIC RANK

Immigrants from Bahamas Wage/Income Gap Correlation Chart

The statistical analysis conducted on geographies consisting of 104,631,049 people shows a mild positive correlation between the proportion of Immigrants from Bahamas and wage/income gap percentage in the United States with a correlation coefficient (R) of 0.305 and weighted average of 21.1%. On average, for every 1% (one percent) increase in Immigrants from Bahamas within a typical geography, there is an increase of 1.7% in wage/income gap percentage.
Immigrants from Bahamas Wage/Income Gap
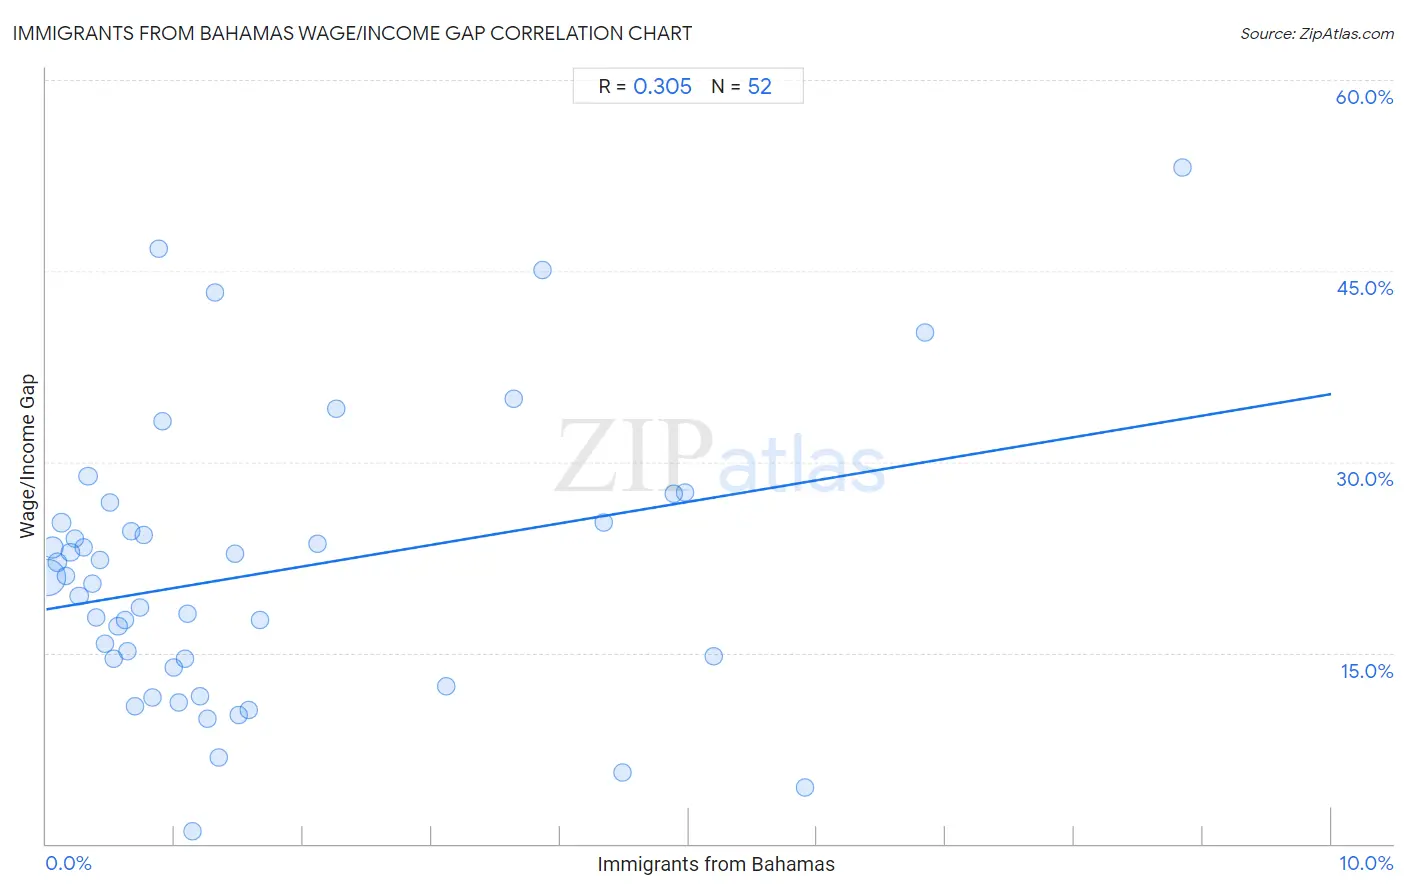
It is essential to understand that the correlation between the percentage of Immigrants from Bahamas and wage/income gap percentage does not imply a direct cause-and-effect relationship. It remains uncertain whether the presence of Immigrants from Bahamas influences an upward or downward trend in the level of wage/income gap percentage within an area, or if Immigrants from Bahamas simply ended up residing in those areas with higher or lower levels of wage/income gap percentage due to other factors.

Demographics Similar to Immigrants from Bahamas by Wage/Income Gap

In terms of wage/income gap, the demographic groups most similar to Immigrants from Bahamas are Immigrants from Yemen (21.1%, a difference of 0.010%), Vietnamese (21.0%, a difference of 0.25%), Pima (21.1%, a difference of 0.28%), Immigrants from Bangladesh (20.9%, a difference of 0.53%), and Immigrants from Senegal (20.9%, a difference of 0.74%).
DemographicsRating | RankWage/Income Gap
Pueblo
100.0
/100
|
#26
Exceptional
20.7%
Immigrants from Armenia
100.0
/100
|
#27
Exceptional
20.7%
Inupiat
100.0
/100
|
#28
Exceptional
20.8%
Immigrants from Senegal
100.0
/100
|
#29
Exceptional
20.9%
Immigrants from Bangladesh
100.0
/100
|
#30
Exceptional
20.9%
Vietnamese
100.0
/100
|
#31
Exceptional
21.0%
Immigrants from Yemen
100.0
/100
|
#32
Exceptional
21.1%
Immigrants from Bahamas
100.0
/100
|
#33
Exceptional
21.1%
Pima
100.0
/100
|
#34
Exceptional
21.1%
Somalis
100.0
/100
|
#35
Exceptional
21.2%
Belizeans
100.0
/100
|
#36
Exceptional
21.2%
Immigrants from Somalia
100.0
/100
|
#37
Exceptional
21.2%
Immigrants from Belize
100.0
/100
|
#38
Exceptional
21.3%
Colville
100.0
/100
|
#39
Exceptional
21.3%
Lumbee
100.0
/100
|
#40
Exceptional
21.3%

Immigrants from Bahamas Wage/Income Gap Correlation Summary

MeasurementImmigrants from Bahamas DataWage/Income Gap Data
Minimum0.012%0.96%
Maximum8.8%53.2%
Range8.8%52.2%
Mean1.7%21.3%
Median0.95%20.7%
Interquartile 25% (IQ1)0.44%14.2%
Interquartile 75% (IQ3)1.9%25.2%
Interquartile Range (IQR)1.4%11.1%
Standard Deviation (Sample)2.0%11.0%
Standard Deviation (Population)2.0%10.9%

Correlation Details

Immigrants from Bahamas PercentileSample SizeWage/Income Gap
[
0.0%
-
0.5%
]
0.012%
70,181,05520.9%
[
0.0%
-
0.5%
]
0.049%
14,056,89123.3%
[
0.0%
-
0.5%
]
0.085%
6,101,84322.1%
[
0.0%
-
0.5%
]
0.12%
3,294,00825.2%
[
0.0%
-
0.5%
]
0.15%
2,364,12921.0%
[
0.0%
-
0.5%
]
0.19%
1,397,89622.9%
[
0.0%
-
0.5%
]
0.22%
1,220,22223.9%
[
0.0%
-
0.5%
]
0.26%
1,257,19219.5%
[
0.0%
-
0.5%
]
0.29%
859,20923.2%
[
0.0%
-
0.5%
]
0.33%
495,38628.9%
[
0.0%
-
0.5%
]
0.36%
705,55120.4%
[
0.0%
-
0.5%
]
0.39%
323,46317.8%
[
0.0%
-
0.5%
]
0.42%
110,87322.3%
[
0.0%
-
0.5%
]
0.46%
393,86215.7%
[
0.0%
-
0.5%
]
0.49%
137,51226.8%
[
0.5%
-
1.0%
]
0.53%
197,53614.5%
[
0.5%
-
1.0%
]
0.56%
97,09417.1%
[
0.5%
-
1.0%
]
0.61%
125,37517.6%
[
0.5%
-
1.0%
]
0.63%
170,22315.1%
[
0.5%
-
1.0%
]
0.66%
17,47624.6%
[
0.5%
-
1.0%
]
0.69%
92,30710.8%
[
0.5%
-
1.0%
]
0.73%
137,60018.6%
[
0.5%
-
1.0%
]
0.76%
65,20224.3%
[
0.5%
-
1.0%
]
0.83%
116,58611.5%
[
0.5%
-
1.0%
]
0.87%
50,59546.7%
[
0.5%
-
1.0%
]
0.91%
38,76733.2%
[
0.5%
-
1.0%
]
0.99%
64,28713.8%
[
1.0%
-
1.5%
]
1.03%
104,82411.1%
[
1.0%
-
1.5%
]
1.08%
159,94414.6%
[
1.0%
-
1.5%
]
1.10%
33,96618.1%
[
1.0%
-
1.5%
]
1.13%
2,3810.96%
[
1.0%
-
1.5%
]
1.19%
47,47011.6%
[
1.0%
-
1.5%
]
1.26%
12,0809.8%
[
1.0%
-
1.5%
]
1.31%
5,17443.3%
[
1.0%
-
1.5%
]
1.34%
42,1566.8%
[
1.0%
-
1.5%
]
1.47%
10,20822.8%
[
1.0%
-
1.5%
]
1.50%
14,55810.1%
[
1.5%
-
2.0%
]
1.58%
43,09910.5%
[
1.5%
-
2.0%
]
1.66%
8,24417.5%
[
2.0%
-
2.5%
]
2.11%
2,79123.6%
[
2.0%
-
2.5%
]
2.26%
2,34934.1%
[
3.0%
-
3.5%
]
3.11%
7,38512.4%
[
3.5%
-
4.0%
]
3.64%
9,67734.9%
[
3.5%
-
4.0%
]
3.86%
18,48745.0%
[
4.0%
-
4.5%
]
4.34%
8,11825.2%
[
4.0%
-
4.5%
]
4.48%
15,7355.6%
[
4.5%
-
5.0%
]
4.89%
2,19027.5%
[
4.5%
-
5.0%
]
4.97%
2,15127.6%
[
5.0%
-
5.5%
]
5.19%
1,54014.7%
[
5.5%
-
6.0%
]
5.90%
3054.4%
[
6.5%
-
7.0%
]
6.84%
2,42640.2%
[
8.5%
-
9.0%
]
8.84%
1,65153.2%