Filipino 4 or more Vehicles in Household
COMPARE
Filipino
Select to Compare
4 or more Vehicles in Household
Filipino 4 or more Vehicles in Household
6.9%
4+ VEHICLES AVAILABLE
97.6/ 100
METRIC RATING
109th/ 347
METRIC RANK
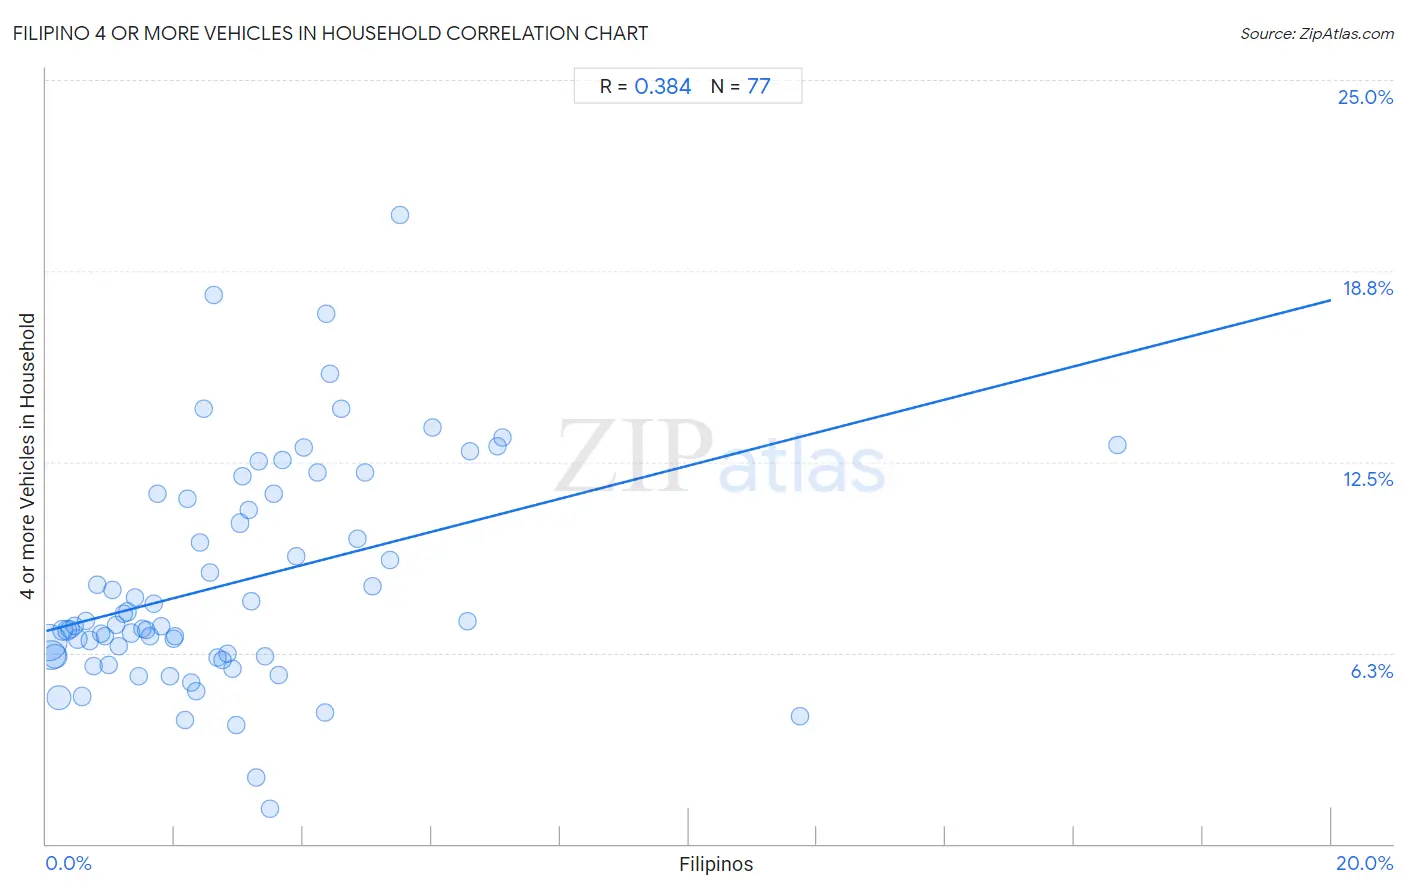
Filipino 4 or more Vehicles in Household Correlation Chart
The statistical analysis conducted on geographies consisting of 252,798,218 people shows a mild positive correlation between the proportion of Filipinos and percentage of households with 4 or more vehicles available in the United States with a correlation coefficient (R) of 0.384 and weighted average of 6.9%. On average, for every 1% (one percent) increase in Filipinos within a typical geography, there is an increase of 0.54% in percentage of households with 4 or more vehicles available.
It is essential to understand that the correlation between the percentage of Filipinos and percentage of households with 4 or more vehicles available does not imply a direct cause-and-effect relationship. It remains uncertain whether the presence of Filipinos influences an upward or downward trend in the level of percentage of households with 4 or more vehicles available within an area, or if Filipinos simply ended up residing in those areas with higher or lower levels of percentage of households with 4 or more vehicles available due to other factors.
Demographics Similar to Filipinos by 4 or more Vehicles in Household
In terms of 4 or more vehicles in household, the demographic groups most similar to Filipinos are French (6.9%, a difference of 0.18%), Immigrants from Thailand (6.9%, a difference of 0.50%), Nicaraguan (7.0%, a difference of 0.52%), Guatemalan (7.0%, a difference of 0.53%), and Aleut (6.9%, a difference of 0.53%).
| Demographics | Rating | Rank | 4 or more Vehicles in Household |
| Asians | 98.6 /100 | #102 | Exceptional 7.0% |
| Blackfeet | 98.6 /100 | #103 | Exceptional 7.0% |
| Hmong | 98.3 /100 | #104 | Exceptional 7.0% |
| German Russians | 98.3 /100 | #105 | Exceptional 7.0% |
| Guatemalans | 98.1 /100 | #106 | Exceptional 7.0% |
| Nicaraguans | 98.0 /100 | #107 | Exceptional 7.0% |
| French | 97.7 /100 | #108 | Exceptional 6.9% |
| Filipinos | 97.6 /100 | #109 | Exceptional 6.9% |
| Immigrants from Thailand | 97.0 /100 | #110 | Exceptional 6.9% |
| Aleuts | 97.0 /100 | #111 | Exceptional 6.9% |
| Hopi | 97.0 /100 | #112 | Exceptional 6.9% |
| Canadians | 96.4 /100 | #113 | Exceptional 6.9% |
| Bolivians | 96.3 /100 | #114 | Exceptional 6.8% |
| Tlingit-Haida | 96.2 /100 | #115 | Exceptional 6.8% |
| Immigrants from Guatemala | 95.8 /100 | #116 | Exceptional 6.8% |
Filipino 4 or more Vehicles in Household Correlation Summary
| Measurement | Filipino Data | 4 or more Vehicles in Household Data |
| Minimum | 0.030% | 1.2% |
| Maximum | 16.7% | 20.6% |
| Range | 16.6% | 19.4% |
| Mean | 2.9% | 8.5% |
| Median | 2.4% | 7.1% |
| Interquartile 25% (IQ1) | 1.1% | 6.1% |
| Interquartile 75% (IQ3) | 3.8% | 11.4% |
| Interquartile Range (IQR) | 2.7% | 5.2% |
| Standard Deviation (Sample) | 2.6% | 3.7% |
| Standard Deviation (Population) | 2.6% | 3.7% |
Correlation Details
| Filipino Percentile | Sample Size | 4 or more Vehicles in Household |
[ 0.0% - 0.5% ] 0.030% | 89,012,644 | 6.6% |
[ 0.0% - 0.5% ] 0.084% | 52,301,528 | 6.2% |
[ 0.0% - 0.5% ] 0.14% | 29,315,371 | 6.1% |
[ 0.0% - 0.5% ] 0.20% | 27,923,077 | 4.8% |
[ 0.0% - 0.5% ] 0.26% | 9,330,867 | 7.0% |
[ 0.0% - 0.5% ] 0.32% | 9,225,778 | 7.0% |
[ 0.0% - 0.5% ] 0.38% | 5,157,142 | 7.0% |
[ 0.0% - 0.5% ] 0.44% | 3,844,153 | 7.1% |
[ 0.0% - 0.5% ] 0.49% | 3,555,382 | 6.7% |
[ 0.5% - 1.0% ] 0.56% | 3,735,438 | 4.8% |
[ 0.5% - 1.0% ] 0.62% | 2,891,223 | 7.3% |
[ 0.5% - 1.0% ] 0.67% | 1,777,853 | 6.7% |
[ 0.5% - 1.0% ] 0.73% | 1,480,555 | 5.8% |
[ 0.5% - 1.0% ] 0.79% | 2,762,021 | 8.5% |
[ 0.5% - 1.0% ] 0.86% | 999,542 | 6.9% |
[ 0.5% - 1.0% ] 0.91% | 779,292 | 6.8% |
[ 0.5% - 1.0% ] 0.97% | 757,742 | 5.9% |
[ 1.0% - 1.5% ] 1.02% | 650,063 | 8.3% |
[ 1.0% - 1.5% ] 1.09% | 1,014,142 | 7.2% |
[ 1.0% - 1.5% ] 1.14% | 324,915 | 6.5% |
[ 1.0% - 1.5% ] 1.20% | 349,884 | 7.5% |
[ 1.0% - 1.5% ] 1.27% | 552,938 | 7.6% |
[ 1.0% - 1.5% ] 1.32% | 619,671 | 6.9% |
[ 1.0% - 1.5% ] 1.39% | 328,228 | 8.0% |
[ 1.0% - 1.5% ] 1.44% | 324,330 | 5.5% |
[ 1.0% - 1.5% ] 1.49% | 239,946 | 7.1% |
[ 1.5% - 2.0% ] 1.55% | 177,822 | 7.0% |
[ 1.5% - 2.0% ] 1.61% | 245,054 | 6.8% |
[ 1.5% - 2.0% ] 1.67% | 253,771 | 7.8% |
[ 1.5% - 2.0% ] 1.74% | 71,805 | 11.5% |
[ 1.5% - 2.0% ] 1.78% | 367,033 | 7.1% |
[ 1.5% - 2.0% ] 1.92% | 183,192 | 5.5% |
[ 1.5% - 2.0% ] 1.98% | 138,170 | 6.7% |
[ 2.0% - 2.5% ] 2.01% | 35,887 | 6.8% |
[ 2.0% - 2.5% ] 2.16% | 44,533 | 4.1% |
[ 2.0% - 2.5% ] 2.20% | 27,784 | 11.3% |
[ 2.0% - 2.5% ] 2.27% | 94,549 | 5.3% |
[ 2.0% - 2.5% ] 2.33% | 422,728 | 5.0% |
[ 2.0% - 2.5% ] 2.40% | 6,634 | 9.8% |
[ 2.0% - 2.5% ] 2.45% | 186,770 | 14.2% |
[ 2.5% - 3.0% ] 2.54% | 42,134 | 8.9% |
[ 2.5% - 3.0% ] 2.60% | 110,950 | 18.0% |
[ 2.5% - 3.0% ] 2.66% | 41,131 | 6.1% |
[ 2.5% - 3.0% ] 2.74% | 68,329 | 6.0% |
[ 2.5% - 3.0% ] 2.81% | 60,121 | 6.2% |
[ 2.5% - 3.0% ] 2.90% | 55,404 | 5.7% |
[ 2.5% - 3.0% ] 2.96% | 7,388 | 3.9% |
[ 3.0% - 3.5% ] 3.02% | 93,858 | 10.5% |
[ 3.0% - 3.5% ] 3.06% | 92,595 | 12.0% |
[ 3.0% - 3.5% ] 3.14% | 34,381 | 10.9% |
[ 3.0% - 3.5% ] 3.19% | 33,517 | 7.9% |
[ 3.0% - 3.5% ] 3.28% | 10,777 | 2.2% |
[ 3.0% - 3.5% ] 3.32% | 37,925 | 12.5% |
[ 3.0% - 3.5% ] 3.40% | 206 | 6.1% |
[ 3.0% - 3.5% ] 3.47% | 259 | 1.2% |
[ 3.5% - 4.0% ] 3.54% | 24,041 | 11.5% |
[ 3.5% - 4.0% ] 3.63% | 1,131 | 5.5% |
[ 3.5% - 4.0% ] 3.68% | 54,534 | 12.6% |
[ 3.5% - 4.0% ] 3.88% | 53,464 | 9.4% |
[ 4.0% - 4.5% ] 4.01% | 89,154 | 13.0% |
[ 4.0% - 4.5% ] 4.22% | 32,415 | 12.1% |
[ 4.0% - 4.5% ] 4.34% | 61,110 | 4.3% |
[ 4.0% - 4.5% ] 4.36% | 28,212 | 17.4% |
[ 4.0% - 4.5% ] 4.41% | 54,484 | 15.4% |
[ 4.5% - 5.0% ] 4.59% | 47,209 | 14.3% |
[ 4.5% - 5.0% ] 4.85% | 783 | 10.0% |
[ 4.5% - 5.0% ] 4.96% | 2,240 | 12.2% |
[ 5.0% - 5.5% ] 5.09% | 57,536 | 8.4% |
[ 5.0% - 5.5% ] 5.35% | 56,948 | 9.3% |
[ 5.5% - 6.0% ] 5.51% | 744 | 20.6% |
[ 6.0% - 6.5% ] 6.02% | 1,280 | 13.6% |
[ 6.5% - 7.0% ] 6.57% | 4,463 | 7.3% |
[ 6.5% - 7.0% ] 6.60% | 3,639 | 12.8% |
[ 7.0% - 7.5% ] 7.03% | 12,559 | 13.0% |
[ 7.0% - 7.5% ] 7.10% | 12,442 | 13.3% |
[ 11.5% - 12.0% ] 11.73% | 1,176 | 4.2% |
[ 16.5% - 17.0% ] 16.67% | 222 | 13.0% |