Filipino Disability
COMPARE
Filipino
Select to Compare
Disability
Filipino Disability
9.6%
DISABILITY
100.0/ 100
METRIC RATING
2nd/ 347
METRIC RANK
Filipino Disability Correlation Chart
The statistical analysis conducted on geographies consisting of 254,346,724 people shows a slight negative correlation between the proportion of Filipinos and percentage of population with a disability in the United States with a correlation coefficient (R) of -0.064 and weighted average of 9.6%. On average, for every 1% (one percent) increase in Filipinos within a typical geography, there is a decrease of 0.061% in percentage of population with a disability.
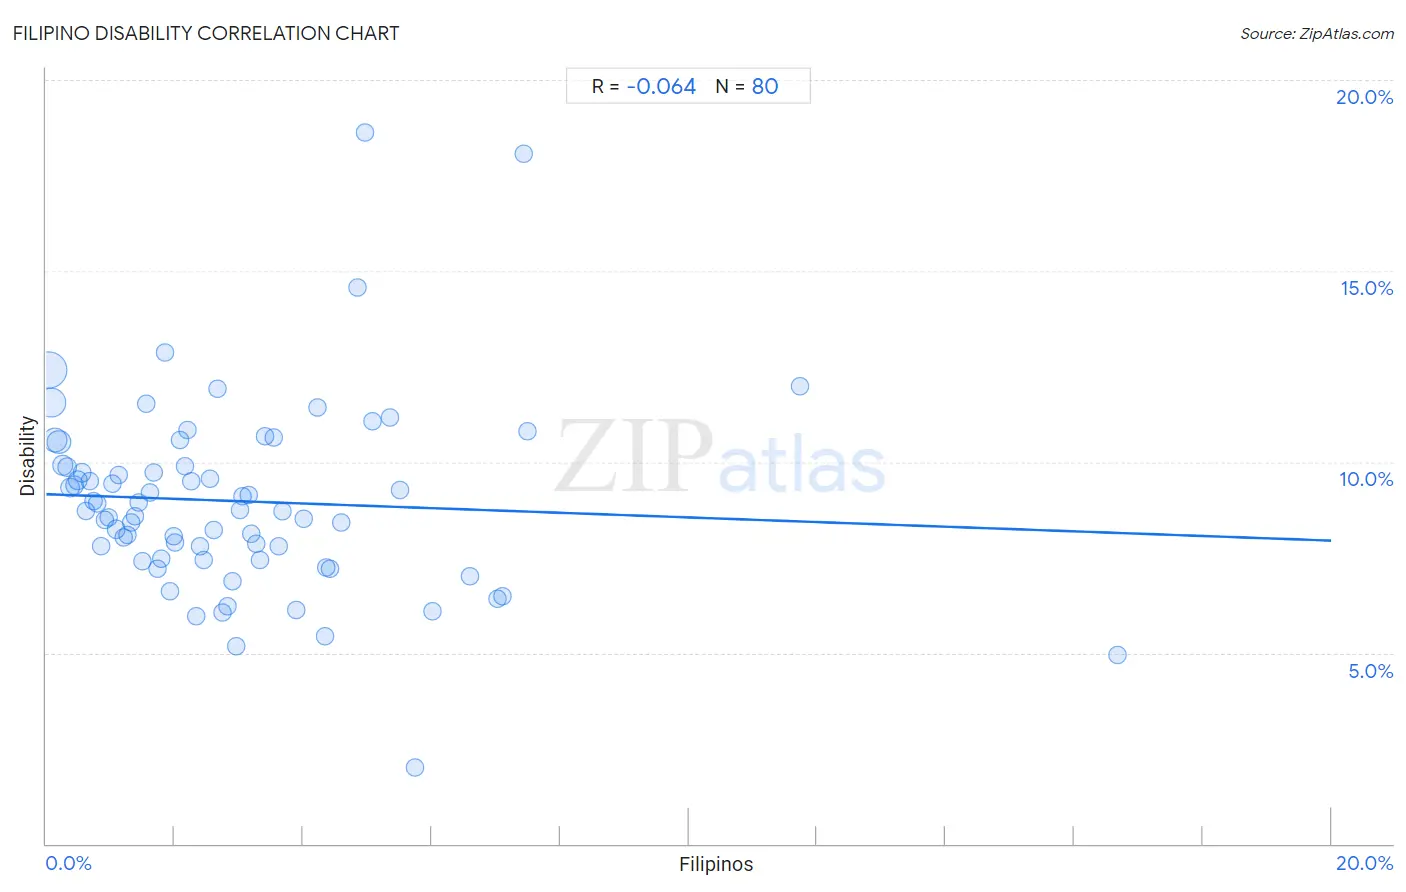
It is essential to understand that the correlation between the percentage of Filipinos and percentage of population with a disability does not imply a direct cause-and-effect relationship. It remains uncertain whether the presence of Filipinos influences an upward or downward trend in the level of percentage of population with a disability within an area, or if Filipinos simply ended up residing in those areas with higher or lower levels of percentage of population with a disability due to other factors.
Demographics Similar to Filipinos by Disability
In terms of disability, the demographic groups most similar to Filipinos are Immigrants from Taiwan (9.6%, a difference of 0.080%), Immigrants from India (9.5%, a difference of 0.98%), Thai (9.7%, a difference of 1.1%), Immigrants from Bolivia (9.9%, a difference of 2.8%), and Immigrants from South Central Asia (9.9%, a difference of 3.7%).
| Demographics | Rating | Rank | Disability |
| Immigrants from India | 100.0 /100 | #1 | Exceptional 9.5% |
| Filipinos | 100.0 /100 | #2 | Exceptional 9.6% |
| Immigrants from Taiwan | 100.0 /100 | #3 | Exceptional 9.6% |
| Thais | 100.0 /100 | #4 | Exceptional 9.7% |
| Immigrants from Bolivia | 100.0 /100 | #5 | Exceptional 9.9% |
| Immigrants from South Central Asia | 100.0 /100 | #6 | Exceptional 9.9% |
| Immigrants from Singapore | 100.0 /100 | #7 | Exceptional 10.0% |
| Bolivians | 100.0 /100 | #8 | Exceptional 10.0% |
| Immigrants from Hong Kong | 100.0 /100 | #9 | Exceptional 10.0% |
| Immigrants from China | 100.0 /100 | #10 | Exceptional 10.1% |
| Iranians | 100.0 /100 | #11 | Exceptional 10.1% |
| Immigrants from Israel | 100.0 /100 | #12 | Exceptional 10.1% |
| Immigrants from Eastern Asia | 100.0 /100 | #13 | Exceptional 10.2% |
| Immigrants from Korea | 100.0 /100 | #14 | Exceptional 10.2% |
| Okinawans | 100.0 /100 | #15 | Exceptional 10.3% |
Filipino Disability Correlation Summary
| Measurement | Filipino Data | Disability Data |
| Minimum | 0.030% | 2.0% |
| Maximum | 16.7% | 18.6% |
| Range | 16.6% | 16.6% |
| Mean | 2.9% | 9.0% |
| Median | 2.4% | 8.7% |
| Interquartile 25% (IQ1) | 1.2% | 7.5% |
| Interquartile 75% (IQ3) | 3.9% | 9.9% |
| Interquartile Range (IQR) | 2.8% | 2.5% |
| Standard Deviation (Sample) | 2.6% | 2.5% |
| Standard Deviation (Population) | 2.6% | 2.5% |
Correlation Details
| Filipino Percentile | Sample Size | Disability |
[ 0.0% - 0.5% ] 0.030% | 89,252,704 | 12.4% |
[ 0.0% - 0.5% ] 0.084% | 52,549,950 | 11.6% |
[ 0.0% - 0.5% ] 0.14% | 29,521,998 | 10.6% |
[ 0.0% - 0.5% ] 0.20% | 28,078,134 | 10.5% |
[ 0.0% - 0.5% ] 0.26% | 9,452,934 | 9.9% |
[ 0.0% - 0.5% ] 0.32% | 9,281,783 | 9.9% |
[ 0.0% - 0.5% ] 0.38% | 5,200,478 | 9.3% |
[ 0.0% - 0.5% ] 0.44% | 3,886,760 | 9.4% |
[ 0.0% - 0.5% ] 0.49% | 3,607,509 | 9.5% |
[ 0.5% - 1.0% ] 0.56% | 3,803,992 | 9.7% |
[ 0.5% - 1.0% ] 0.62% | 2,924,557 | 8.7% |
[ 0.5% - 1.0% ] 0.67% | 1,793,949 | 9.5% |
[ 0.5% - 1.0% ] 0.73% | 1,488,919 | 9.0% |
[ 0.5% - 1.0% ] 0.79% | 2,786,045 | 8.9% |
[ 0.5% - 1.0% ] 0.86% | 1,011,730 | 7.8% |
[ 0.5% - 1.0% ] 0.91% | 781,790 | 8.5% |
[ 0.5% - 1.0% ] 0.97% | 769,168 | 8.5% |
[ 1.0% - 1.5% ] 1.02% | 650,159 | 9.4% |
[ 1.0% - 1.5% ] 1.09% | 1,019,953 | 8.2% |
[ 1.0% - 1.5% ] 1.14% | 324,915 | 9.7% |
[ 1.0% - 1.5% ] 1.20% | 354,840 | 8.0% |
[ 1.0% - 1.5% ] 1.27% | 552,938 | 8.1% |
[ 1.0% - 1.5% ] 1.32% | 621,429 | 8.4% |
[ 1.0% - 1.5% ] 1.39% | 395,186 | 8.6% |
[ 1.0% - 1.5% ] 1.44% | 329,699 | 8.9% |
[ 1.0% - 1.5% ] 1.49% | 250,193 | 7.4% |
[ 1.5% - 2.0% ] 1.55% | 218,814 | 11.5% |
[ 1.5% - 2.0% ] 1.61% | 254,886 | 9.2% |
[ 1.5% - 2.0% ] 1.67% | 253,771 | 9.7% |
[ 1.5% - 2.0% ] 1.74% | 72,794 | 7.2% |
[ 1.5% - 2.0% ] 1.78% | 368,100 | 7.5% |
[ 1.5% - 2.0% ] 1.85% | 13,303 | 12.9% |
[ 1.5% - 2.0% ] 1.92% | 183,192 | 6.6% |
[ 1.5% - 2.0% ] 1.98% | 138,170 | 8.0% |
[ 2.0% - 2.5% ] 2.01% | 35,887 | 7.9% |
[ 2.0% - 2.5% ] 2.08% | 7,007 | 10.6% |
[ 2.0% - 2.5% ] 2.15% | 62,901 | 9.9% |
[ 2.0% - 2.5% ] 2.20% | 27,784 | 10.8% |
[ 2.0% - 2.5% ] 2.27% | 96,903 | 9.5% |
[ 2.0% - 2.5% ] 2.33% | 422,728 | 6.0% |
[ 2.0% - 2.5% ] 2.39% | 7,315 | 7.8% |
[ 2.0% - 2.5% ] 2.45% | 186,770 | 7.4% |
[ 2.5% - 3.0% ] 2.54% | 42,134 | 9.6% |
[ 2.5% - 3.0% ] 2.60% | 117,084 | 8.2% |
[ 2.5% - 3.0% ] 2.66% | 41,131 | 11.9% |
[ 2.5% - 3.0% ] 2.74% | 68,329 | 6.0% |
[ 2.5% - 3.0% ] 2.81% | 60,121 | 6.2% |
[ 2.5% - 3.0% ] 2.90% | 55,404 | 6.9% |
[ 2.5% - 3.0% ] 2.96% | 7,388 | 5.2% |
[ 3.0% - 3.5% ] 3.02% | 93,858 | 8.7% |
[ 3.0% - 3.5% ] 3.06% | 92,595 | 9.1% |
[ 3.0% - 3.5% ] 3.14% | 34,381 | 9.1% |
[ 3.0% - 3.5% ] 3.19% | 33,517 | 8.1% |
[ 3.0% - 3.5% ] 3.28% | 10,777 | 7.9% |
[ 3.0% - 3.5% ] 3.32% | 38,135 | 7.4% |
[ 3.0% - 3.5% ] 3.40% | 206 | 10.7% |
[ 3.5% - 4.0% ] 3.54% | 24,041 | 10.6% |
[ 3.5% - 4.0% ] 3.63% | 1,131 | 7.8% |
[ 3.5% - 4.0% ] 3.68% | 54,534 | 8.7% |
[ 3.5% - 4.0% ] 3.88% | 53,464 | 6.1% |
[ 4.0% - 4.5% ] 4.01% | 89,154 | 8.5% |
[ 4.0% - 4.5% ] 4.22% | 32,415 | 11.4% |
[ 4.0% - 4.5% ] 4.34% | 65,806 | 5.4% |
[ 4.0% - 4.5% ] 4.36% | 28,212 | 7.2% |
[ 4.0% - 4.5% ] 4.41% | 54,484 | 7.2% |
[ 4.5% - 5.0% ] 4.59% | 47,209 | 8.4% |
[ 4.5% - 5.0% ] 4.85% | 783 | 14.6% |
[ 4.5% - 5.0% ] 4.96% | 2,240 | 18.6% |
[ 5.0% - 5.5% ] 5.09% | 57,536 | 11.1% |
[ 5.0% - 5.5% ] 5.35% | 56,948 | 11.2% |
[ 5.5% - 6.0% ] 5.51% | 744 | 9.3% |
[ 5.5% - 6.0% ] 5.74% | 7,280 | 2.0% |
[ 6.0% - 6.5% ] 6.02% | 1,280 | 6.1% |
[ 6.5% - 7.0% ] 6.60% | 3,639 | 7.0% |
[ 7.0% - 7.5% ] 7.03% | 12,559 | 6.4% |
[ 7.0% - 7.5% ] 7.10% | 12,442 | 6.5% |
[ 7.0% - 7.5% ] 7.43% | 404 | 18.1% |
[ 7.0% - 7.5% ] 7.48% | 1,924 | 10.8% |
[ 11.5% - 12.0% ] 11.73% | 1,176 | 12.0% |
[ 16.5% - 17.0% ] 16.67% | 222 | 5.0% |