Filipino 3 or more Vehicles in Household
COMPARE
Filipino
Select to Compare
3 or more Vehicles in Household
Filipino 3 or more Vehicles in Household
20.8%
3+ VEHICLES AVAILABLE
97.0/ 100
METRIC RATING
109th/ 347
METRIC RANK
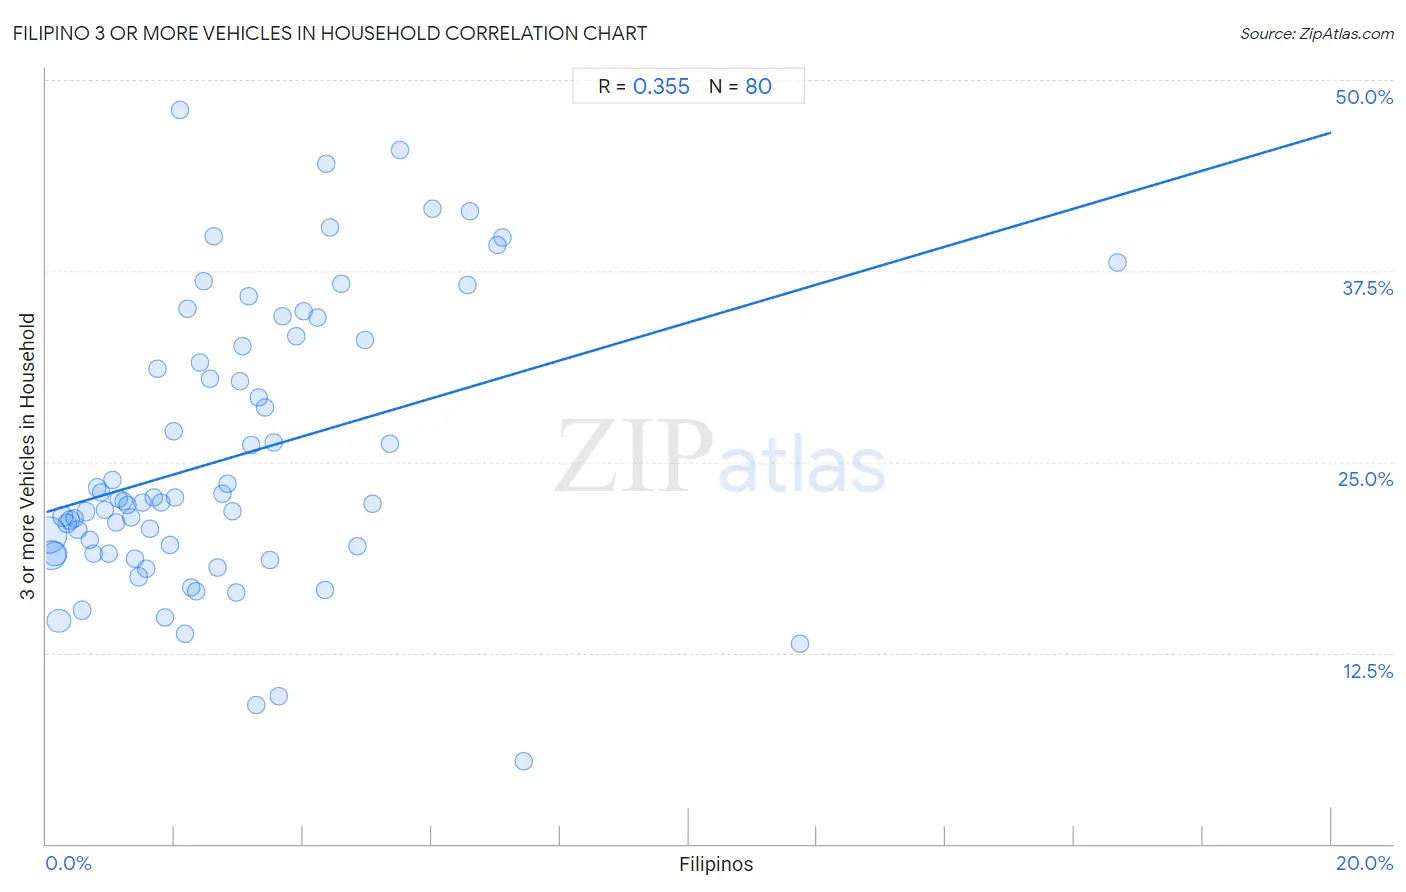
Filipino 3 or more Vehicles in Household Correlation Chart
The statistical analysis conducted on geographies consisting of 254,051,134 people shows a mild positive correlation between the proportion of Filipinos and percentage of households with 3 or more vehicles available in the United States with a correlation coefficient (R) of 0.355 and weighted average of 20.8%. On average, for every 1% (one percent) increase in Filipinos within a typical geography, there is an increase of 1.2% in percentage of households with 3 or more vehicles available.
It is essential to understand that the correlation between the percentage of Filipinos and percentage of households with 3 or more vehicles available does not imply a direct cause-and-effect relationship. It remains uncertain whether the presence of Filipinos influences an upward or downward trend in the level of percentage of households with 3 or more vehicles available within an area, or if Filipinos simply ended up residing in those areas with higher or lower levels of percentage of households with 3 or more vehicles available due to other factors.
Demographics Similar to Filipinos by 3 or more Vehicles in Household
In terms of 3 or more vehicles in household, the demographic groups most similar to Filipinos are Immigrants from Scotland (20.8%, a difference of 0.060%), Asian (20.8%, a difference of 0.14%), Immigrants from Micronesia (20.7%, a difference of 0.17%), Immigrants from Germany (20.8%, a difference of 0.21%), and Bolivian (20.8%, a difference of 0.25%).
| Demographics | Rating | Rank | 3 or more Vehicles in Household |
| Seminole | 97.8 /100 | #102 | Exceptional 20.9% |
| Dutch West Indians | 97.8 /100 | #103 | Exceptional 20.9% |
| Luxembourgers | 97.7 /100 | #104 | Exceptional 20.9% |
| Austrians | 97.5 /100 | #105 | Exceptional 20.9% |
| Bolivians | 97.4 /100 | #106 | Exceptional 20.8% |
| Immigrants from Germany | 97.4 /100 | #107 | Exceptional 20.8% |
| Immigrants from Scotland | 97.1 /100 | #108 | Exceptional 20.8% |
| Filipinos | 97.0 /100 | #109 | Exceptional 20.8% |
| Asians | 96.8 /100 | #110 | Exceptional 20.8% |
| Immigrants from Micronesia | 96.7 /100 | #111 | Exceptional 20.7% |
| Nicaraguans | 96.2 /100 | #112 | Exceptional 20.7% |
| Immigrants from England | 96.2 /100 | #113 | Exceptional 20.7% |
| Burmese | 95.8 /100 | #114 | Exceptional 20.6% |
| French Canadians | 95.0 /100 | #115 | Exceptional 20.6% |
| Italians | 94.9 /100 | #116 | Exceptional 20.6% |
Filipino 3 or more Vehicles in Household Correlation Summary
| Measurement | Filipino Data | 3 or more Vehicles in Household Data |
| Minimum | 0.030% | 5.4% |
| Maximum | 16.7% | 48.0% |
| Range | 16.6% | 42.6% |
| Mean | 2.9% | 25.3% |
| Median | 2.4% | 22.4% |
| Interquartile 25% (IQ1) | 1.2% | 19.0% |
| Interquartile 75% (IQ3) | 3.8% | 32.8% |
| Interquartile Range (IQR) | 2.6% | 13.8% |
| Standard Deviation (Sample) | 2.6% | 9.2% |
| Standard Deviation (Population) | 2.6% | 9.1% |
Correlation Details
| Filipino Percentile | Sample Size | 3 or more Vehicles in Household |
[ 0.0% - 0.5% ] 0.030% | 89,221,135 | 20.2% |
[ 0.0% - 0.5% ] 0.084% | 52,547,345 | 18.9% |
[ 0.0% - 0.5% ] 0.14% | 29,478,230 | 19.0% |
[ 0.0% - 0.5% ] 0.20% | 28,046,193 | 14.6% |
[ 0.0% - 0.5% ] 0.26% | 9,443,142 | 21.4% |
[ 0.0% - 0.5% ] 0.32% | 9,266,053 | 21.0% |
[ 0.0% - 0.5% ] 0.38% | 5,187,387 | 21.2% |
[ 0.0% - 0.5% ] 0.44% | 3,873,254 | 21.3% |
[ 0.0% - 0.5% ] 0.49% | 3,595,030 | 20.6% |
[ 0.5% - 1.0% ] 0.56% | 3,789,916 | 15.3% |
[ 0.5% - 1.0% ] 0.62% | 2,891,691 | 21.7% |
[ 0.5% - 1.0% ] 0.67% | 1,791,860 | 19.9% |
[ 0.5% - 1.0% ] 0.73% | 1,488,919 | 19.0% |
[ 0.5% - 1.0% ] 0.79% | 2,766,765 | 23.3% |
[ 0.5% - 1.0% ] 0.86% | 1,005,004 | 23.0% |
[ 0.5% - 1.0% ] 0.91% | 781,790 | 21.9% |
[ 0.5% - 1.0% ] 0.97% | 767,947 | 19.0% |
[ 1.0% - 1.5% ] 1.02% | 650,159 | 23.8% |
[ 1.0% - 1.5% ] 1.09% | 1,014,142 | 21.0% |
[ 1.0% - 1.5% ] 1.14% | 324,915 | 22.6% |
[ 1.0% - 1.5% ] 1.20% | 352,639 | 22.4% |
[ 1.0% - 1.5% ] 1.27% | 552,938 | 22.2% |
[ 1.0% - 1.5% ] 1.32% | 619,671 | 21.4% |
[ 1.0% - 1.5% ] 1.39% | 394,107 | 18.6% |
[ 1.0% - 1.5% ] 1.44% | 329,699 | 17.5% |
[ 1.0% - 1.5% ] 1.49% | 244,420 | 22.4% |
[ 1.5% - 2.0% ] 1.55% | 216,770 | 18.0% |
[ 1.5% - 2.0% ] 1.61% | 254,886 | 20.6% |
[ 1.5% - 2.0% ] 1.67% | 253,771 | 22.6% |
[ 1.5% - 2.0% ] 1.74% | 71,805 | 31.1% |
[ 1.5% - 2.0% ] 1.78% | 367,033 | 22.3% |
[ 1.5% - 2.0% ] 1.85% | 13,303 | 14.8% |
[ 1.5% - 2.0% ] 1.92% | 183,192 | 19.6% |
[ 1.5% - 2.0% ] 1.98% | 138,170 | 27.0% |
[ 2.0% - 2.5% ] 2.01% | 35,887 | 22.6% |
[ 2.0% - 2.5% ] 2.08% | 7,007 | 48.0% |
[ 2.0% - 2.5% ] 2.15% | 56,116 | 13.8% |
[ 2.0% - 2.5% ] 2.20% | 27,784 | 35.0% |
[ 2.0% - 2.5% ] 2.27% | 94,549 | 16.8% |
[ 2.0% - 2.5% ] 2.33% | 422,728 | 16.5% |
[ 2.0% - 2.5% ] 2.39% | 7,315 | 31.5% |
[ 2.0% - 2.5% ] 2.45% | 186,770 | 36.9% |
[ 2.5% - 3.0% ] 2.54% | 42,134 | 30.4% |
[ 2.5% - 3.0% ] 2.60% | 110,950 | 39.7% |
[ 2.5% - 3.0% ] 2.66% | 41,131 | 18.0% |
[ 2.5% - 3.0% ] 2.74% | 68,329 | 22.9% |
[ 2.5% - 3.0% ] 2.81% | 60,121 | 23.6% |
[ 2.5% - 3.0% ] 2.90% | 55,404 | 21.8% |
[ 2.5% - 3.0% ] 2.96% | 7,388 | 16.5% |
[ 3.0% - 3.5% ] 3.02% | 93,858 | 30.3% |
[ 3.0% - 3.5% ] 3.06% | 92,595 | 32.6% |
[ 3.0% - 3.5% ] 3.14% | 34,381 | 35.8% |
[ 3.0% - 3.5% ] 3.19% | 33,517 | 26.1% |
[ 3.0% - 3.5% ] 3.28% | 10,777 | 9.1% |
[ 3.0% - 3.5% ] 3.32% | 37,925 | 29.2% |
[ 3.0% - 3.5% ] 3.40% | 206 | 28.6% |
[ 3.0% - 3.5% ] 3.47% | 259 | 18.6% |
[ 3.5% - 4.0% ] 3.54% | 24,041 | 26.3% |
[ 3.5% - 4.0% ] 3.63% | 1,131 | 9.7% |
[ 3.5% - 4.0% ] 3.68% | 54,534 | 34.6% |
[ 3.5% - 4.0% ] 3.88% | 53,464 | 33.2% |
[ 4.0% - 4.5% ] 4.01% | 89,154 | 34.9% |
[ 4.0% - 4.5% ] 4.22% | 32,415 | 34.5% |
[ 4.0% - 4.5% ] 4.34% | 61,642 | 16.6% |
[ 4.0% - 4.5% ] 4.36% | 28,212 | 44.5% |
[ 4.0% - 4.5% ] 4.41% | 54,484 | 40.3% |
[ 4.5% - 5.0% ] 4.59% | 47,209 | 36.7% |
[ 4.5% - 5.0% ] 4.85% | 783 | 19.5% |
[ 4.5% - 5.0% ] 4.96% | 2,240 | 33.0% |
[ 5.0% - 5.5% ] 5.09% | 57,536 | 22.3% |
[ 5.0% - 5.5% ] 5.35% | 56,948 | 26.2% |
[ 5.5% - 6.0% ] 5.51% | 744 | 45.4% |
[ 6.0% - 6.5% ] 6.02% | 1,280 | 41.6% |
[ 6.5% - 7.0% ] 6.57% | 4,463 | 36.6% |
[ 6.5% - 7.0% ] 6.60% | 3,639 | 41.4% |
[ 7.0% - 7.5% ] 7.03% | 12,559 | 39.2% |
[ 7.0% - 7.5% ] 7.10% | 12,442 | 39.7% |
[ 7.0% - 7.5% ] 7.43% | 404 | 5.4% |
[ 11.5% - 12.0% ] 11.73% | 1,176 | 13.1% |
[ 16.5% - 17.0% ] 16.67% | 222 | 38.0% |