Cuban College, 1 year or more
COMPARE
Cuban
Select to Compare
College, 1 year or more
Cuban College, 1 year or more
53.4%
COLLEGE, 1 YEAR OR MORE
0.0/ 100
METRIC RATING
291st/ 347
METRIC RANK
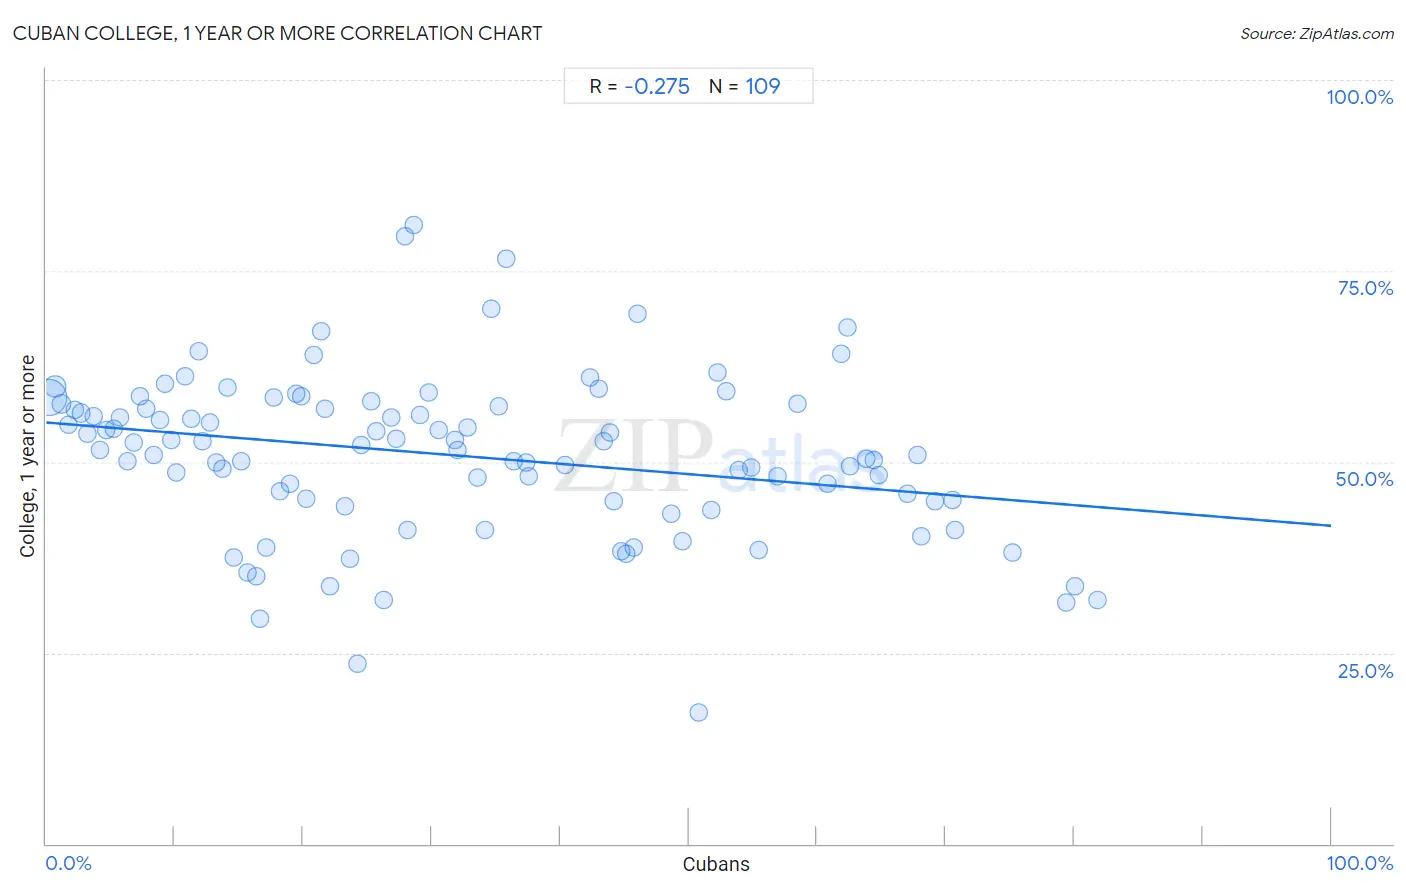
Cuban College, 1 year or more Correlation Chart
The statistical analysis conducted on geographies consisting of 449,372,622 people shows a weak negative correlation between the proportion of Cubans and percentage of population with at least college, 1 year or more education in the United States with a correlation coefficient (R) of -0.275 and weighted average of 53.4%. On average, for every 1% (one percent) increase in Cubans within a typical geography, there is a decrease of 0.14% in percentage of population with at least college, 1 year or more education.
It is essential to understand that the correlation between the percentage of Cubans and percentage of population with at least college, 1 year or more education does not imply a direct cause-and-effect relationship. It remains uncertain whether the presence of Cubans influences an upward or downward trend in the level of percentage of population with at least college, 1 year or more education within an area, or if Cubans simply ended up residing in those areas with higher or lower levels of percentage of population with at least college, 1 year or more education due to other factors.
Demographics Similar to Cubans by College, 1 year or more
In terms of college, 1 year or more, the demographic groups most similar to Cubans are Alaskan Athabascan (53.4%, a difference of 0.050%), Alaska Native (53.4%, a difference of 0.070%), Immigrants from Ecuador (53.4%, a difference of 0.070%), Chickasaw (53.3%, a difference of 0.13%), and Black/African American (53.3%, a difference of 0.15%).
| Demographics | Rating | Rank | College, 1 year or more |
| Ute | 0.1 /100 | #284 | Tragic 53.8% |
| Immigrants from Guyana | 0.1 /100 | #285 | Tragic 53.5% |
| Central American Indians | 0.1 /100 | #286 | Tragic 53.5% |
| Immigrants from Belize | 0.1 /100 | #287 | Tragic 53.5% |
| Alaska Natives | 0.0 /100 | #288 | Tragic 53.4% |
| Immigrants from Ecuador | 0.0 /100 | #289 | Tragic 53.4% |
| Alaskan Athabascans | 0.0 /100 | #290 | Tragic 53.4% |
| Cubans | 0.0 /100 | #291 | Tragic 53.4% |
| Chickasaw | 0.0 /100 | #292 | Tragic 53.3% |
| Blacks/African Americans | 0.0 /100 | #293 | Tragic 53.3% |
| Cherokee | 0.0 /100 | #294 | Tragic 53.2% |
| Yaqui | 0.0 /100 | #295 | Tragic 53.2% |
| Sioux | 0.0 /100 | #296 | Tragic 53.0% |
| Paiute | 0.0 /100 | #297 | Tragic 52.9% |
| Immigrants from Dominica | 0.0 /100 | #298 | Tragic 52.5% |
Cuban College, 1 year or more Correlation Summary
| Measurement | Cuban Data | College, 1 year or more Data |
| Minimum | 0.21% | 17.3% |
| Maximum | 81.9% | 81.0% |
| Range | 81.6% | 63.7% |
| Mean | 32.0% | 50.8% |
| Median | 27.9% | 51.5% |
| Interquartile 25% (IQ1) | 13.5% | 44.8% |
| Interquartile 75% (IQ3) | 49.1% | 57.4% |
| Interquartile Range (IQR) | 35.6% | 12.6% |
| Standard Deviation (Sample) | 22.0% | 10.8% |
| Standard Deviation (Population) | 21.9% | 10.8% |
Correlation Details
| Cuban Percentile | Sample Size | College, 1 year or more |
[ 0.0% - 0.5% ] 0.21% | 333,622,178 | 58.4% |
[ 0.5% - 1.0% ] 0.69% | 60,620,452 | 59.9% |
[ 1.0% - 1.5% ] 1.21% | 16,898,110 | 57.6% |
[ 1.5% - 2.0% ] 1.70% | 9,845,744 | 54.9% |
[ 2.0% - 2.5% ] 2.24% | 5,687,819 | 56.9% |
[ 2.5% - 3.0% ] 2.73% | 4,785,677 | 56.4% |
[ 3.0% - 3.5% ] 3.24% | 2,354,331 | 53.7% |
[ 3.5% - 4.0% ] 3.73% | 1,880,402 | 55.9% |
[ 4.0% - 4.5% ] 4.22% | 1,153,950 | 51.5% |
[ 4.5% - 5.0% ] 4.71% | 840,157 | 54.2% |
[ 5.0% - 5.5% ] 5.27% | 859,431 | 54.3% |
[ 5.5% - 6.0% ] 5.70% | 731,667 | 55.9% |
[ 6.0% - 6.5% ] 6.28% | 533,132 | 50.1% |
[ 6.5% - 7.0% ] 6.78% | 354,111 | 52.5% |
[ 7.0% - 7.5% ] 7.31% | 458,652 | 58.6% |
[ 7.5% - 8.0% ] 7.75% | 859,815 | 57.0% |
[ 8.0% - 8.5% ] 8.34% | 350,181 | 51.0% |
[ 8.5% - 9.0% ] 8.85% | 339,486 | 55.5% |
[ 9.0% - 9.5% ] 9.27% | 251,121 | 60.2% |
[ 9.5% - 10.0% ] 9.72% | 127,829 | 52.9% |
[ 10.0% - 10.5% ] 10.11% | 282,270 | 48.6% |
[ 10.5% - 11.0% ] 10.76% | 169,765 | 61.2% |
[ 11.0% - 11.5% ] 11.25% | 199,621 | 55.6% |
[ 11.5% - 12.0% ] 11.82% | 85,803 | 64.5% |
[ 12.0% - 12.5% ] 12.15% | 190,194 | 52.6% |
[ 12.5% - 13.0% ] 12.79% | 139,706 | 55.1% |
[ 13.0% - 13.5% ] 13.25% | 253,483 | 49.9% |
[ 13.5% - 14.0% ] 13.75% | 144,579 | 49.1% |
[ 14.0% - 14.5% ] 14.07% | 32,641 | 59.8% |
[ 14.5% - 15.0% ] 14.62% | 100,510 | 37.4% |
[ 15.0% - 15.5% ] 15.14% | 354,114 | 50.0% |
[ 15.5% - 16.0% ] 15.67% | 8,205 | 35.5% |
[ 16.0% - 16.5% ] 16.37% | 56,734 | 35.1% |
[ 16.5% - 17.0% ] 16.66% | 18,035 | 29.5% |
[ 17.0% - 17.5% ] 17.13% | 148,170 | 38.8% |
[ 17.5% - 18.0% ] 17.73% | 84,991 | 58.5% |
[ 18.0% - 18.5% ] 18.15% | 182,547 | 46.2% |
[ 18.5% - 19.0% ] 18.94% | 75,780 | 47.2% |
[ 19.0% - 19.5% ] 19.48% | 13,265 | 58.9% |
[ 19.5% - 20.0% ] 19.81% | 96,744 | 58.7% |
[ 20.0% - 20.5% ] 20.27% | 80,415 | 45.1% |
[ 20.5% - 21.0% ] 20.86% | 125,179 | 64.0% |
[ 21.0% - 21.5% ] 21.40% | 53,076 | 67.1% |
[ 21.5% - 22.0% ] 21.70% | 40,853 | 56.9% |
[ 22.0% - 22.5% ] 22.05% | 77,008 | 33.7% |
[ 23.0% - 23.5% ] 23.25% | 701 | 44.3% |
[ 23.5% - 24.0% ] 23.67% | 50,571 | 37.2% |
[ 24.0% - 24.5% ] 24.19% | 62 | 23.5% |
[ 24.5% - 25.0% ] 24.55% | 10,609 | 52.1% |
[ 25.0% - 25.5% ] 25.25% | 123,956 | 57.9% |
[ 25.5% - 26.0% ] 25.70% | 126,156 | 54.0% |
[ 26.0% - 26.5% ] 26.23% | 33,851 | 31.9% |
[ 26.5% - 27.0% ] 26.84% | 56,068 | 55.8% |
[ 27.0% - 27.5% ] 27.20% | 261 | 53.1% |
[ 27.5% - 28.0% ] 27.92% | 15,184 | 79.5% |
[ 28.0% - 28.5% ] 28.15% | 96,294 | 41.1% |
[ 28.5% - 29.0% ] 28.65% | 81,384 | 81.0% |
[ 29.0% - 29.5% ] 29.11% | 35,969 | 56.1% |
[ 29.5% - 30.0% ] 29.72% | 45,100 | 59.1% |
[ 30.5% - 31.0% ] 30.58% | 70,408 | 54.2% |
[ 31.5% - 32.0% ] 31.84% | 112,692 | 52.9% |
[ 32.0% - 32.5% ] 32.04% | 497,852 | 51.5% |
[ 32.5% - 33.0% ] 32.78% | 150,531 | 54.4% |
[ 33.5% - 34.0% ] 33.61% | 81,319 | 47.9% |
[ 34.0% - 34.5% ] 34.13% | 47,255 | 41.1% |
[ 34.5% - 35.0% ] 34.64% | 78,402 | 70.1% |
[ 35.0% - 35.5% ] 35.19% | 147,444 | 57.3% |
[ 35.5% - 36.0% ] 35.76% | 17,902 | 76.7% |
[ 36.0% - 36.5% ] 36.36% | 23,799 | 50.1% |
[ 37.0% - 37.5% ] 37.36% | 4,106 | 49.8% |
[ 37.5% - 38.0% ] 37.56% | 27,084 | 48.1% |
[ 40.0% - 40.5% ] 40.39% | 40,278 | 49.6% |
[ 42.0% - 42.5% ] 42.36% | 88,933 | 61.0% |
[ 42.5% - 43.0% ] 42.98% | 29,570 | 59.6% |
[ 43.0% - 43.5% ] 43.35% | 76,412 | 52.7% |
[ 43.5% - 44.0% ] 43.83% | 105,481 | 53.9% |
[ 44.0% - 44.5% ] 44.15% | 56,791 | 44.8% |
[ 44.5% - 45.0% ] 44.76% | 45,669 | 38.3% |
[ 45.0% - 45.5% ] 45.18% | 35,705 | 37.9% |
[ 45.5% - 46.0% ] 45.68% | 68,602 | 38.9% |
[ 46.0% - 46.5% ] 46.05% | 33,026 | 69.4% |
[ 48.5% - 49.0% ] 48.64% | 81,858 | 43.2% |
[ 49.5% - 50.0% ] 49.52% | 519 | 39.7% |
[ 50.5% - 51.0% ] 50.74% | 3,400 | 17.3% |
[ 51.5% - 52.0% ] 51.73% | 34,335 | 43.7% |
[ 52.0% - 52.5% ] 52.27% | 13,163 | 61.7% |
[ 52.5% - 53.0% ] 52.97% | 29,530 | 59.3% |
[ 53.5% - 54.0% ] 53.91% | 42,710 | 49.0% |
[ 54.5% - 55.0% ] 54.83% | 34,057 | 49.2% |
[ 55.0% - 55.5% ] 55.44% | 19,399 | 38.5% |
[ 56.5% - 57.0% ] 56.95% | 52,661 | 48.2% |
[ 58.0% - 58.5% ] 58.48% | 43,702 | 57.6% |
[ 60.5% - 61.0% ] 60.80% | 52,101 | 47.1% |
[ 61.5% - 62.0% ] 61.83% | 30,621 | 64.2% |
[ 62.0% - 62.5% ] 62.37% | 13,877 | 67.7% |
[ 62.5% - 63.0% ] 62.57% | 55,241 | 49.4% |
[ 63.5% - 64.0% ] 63.81% | 52,851 | 50.4% |
[ 64.0% - 64.5% ] 64.40% | 53,765 | 50.3% |
[ 64.5% - 65.0% ] 64.80% | 24,597 | 48.3% |
[ 67.0% - 67.5% ] 67.07% | 45,620 | 45.9% |
[ 67.5% - 68.0% ] 67.76% | 104,796 | 50.8% |
[ 68.0% - 68.5% ] 68.14% | 10,725 | 40.3% |
[ 69.0% - 69.5% ] 69.21% | 21,076 | 44.8% |
[ 70.0% - 70.5% ] 70.48% | 53,065 | 45.0% |
[ 70.5% - 71.0% ] 70.69% | 22,815 | 41.1% |
[ 75.0% - 75.5% ] 75.16% | 249,779 | 38.2% |
[ 79.0% - 79.5% ] 79.36% | 42,081 | 31.5% |
[ 80.0% - 80.5% ] 80.06% | 71,088 | 33.7% |
[ 81.5% - 82.0% ] 81.85% | 29,830 | 31.9% |