Cuban Self-Care Disability
COMPARE
Cuban
Select to Compare
Self-Care Disability
Cuban Self-Care Disability
2.7%
SELF-CARE DISABILITY
0.0/ 100
METRIC RATING
290th/ 347
METRIC RANK
Cuban Self-Care Disability Correlation Chart
The statistical analysis conducted on geographies consisting of 448,682,941 people shows a moderate positive correlation between the proportion of Cubans and percentage of population with self-care disability in the United States with a correlation coefficient (R) of 0.429 and weighted average of 2.7%. On average, for every 1% (one percent) increase in Cubans within a typical geography, there is an increase of 0.016% in percentage of population with self-care disability.
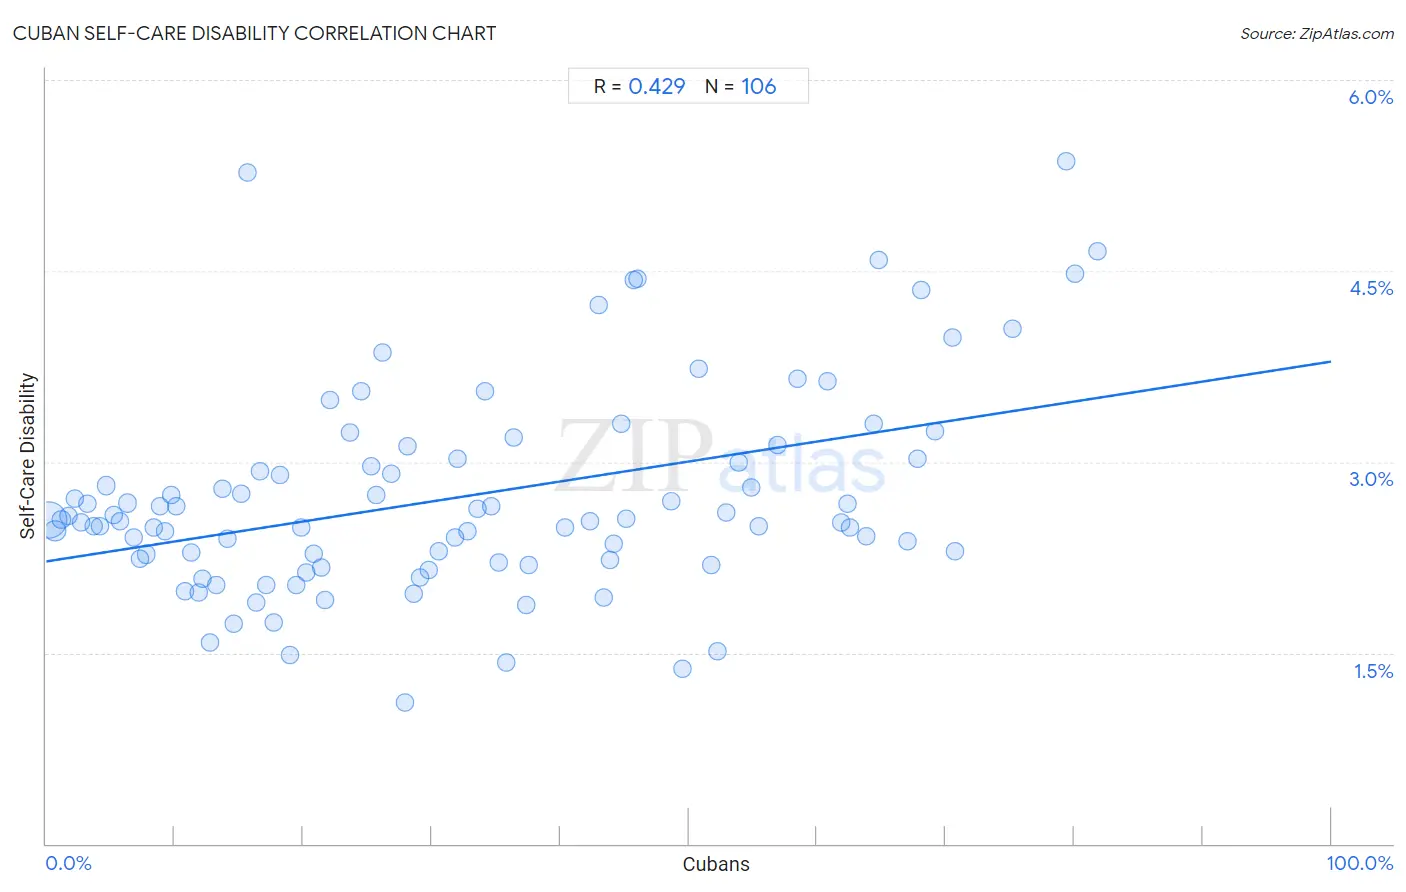
It is essential to understand that the correlation between the percentage of Cubans and percentage of population with self-care disability does not imply a direct cause-and-effect relationship. It remains uncertain whether the presence of Cubans influences an upward or downward trend in the level of percentage of population with self-care disability within an area, or if Cubans simply ended up residing in those areas with higher or lower levels of percentage of population with self-care disability due to other factors.
Demographics Similar to Cubans by Self-Care Disability
In terms of self-care disability, the demographic groups most similar to Cubans are African (2.7%, a difference of 0.15%), Immigrants from Barbados (2.7%, a difference of 0.25%), Guyanese (2.7%, a difference of 0.26%), Immigrants from Jamaica (2.7%, a difference of 0.29%), and Central American Indian (2.7%, a difference of 0.42%).
| Demographics | Rating | Rank | Self-Care Disability |
| Delaware | 0.0 /100 | #283 | Tragic 2.7% |
| Fijians | 0.0 /100 | #284 | Tragic 2.7% |
| Jamaicans | 0.0 /100 | #285 | Tragic 2.7% |
| French American Indians | 0.0 /100 | #286 | Tragic 2.7% |
| Immigrants from Jamaica | 0.0 /100 | #287 | Tragic 2.7% |
| Immigrants from Barbados | 0.0 /100 | #288 | Tragic 2.7% |
| Africans | 0.0 /100 | #289 | Tragic 2.7% |
| Cubans | 0.0 /100 | #290 | Tragic 2.7% |
| Guyanese | 0.0 /100 | #291 | Tragic 2.7% |
| Central American Indians | 0.0 /100 | #292 | Tragic 2.7% |
| Belizeans | 0.0 /100 | #293 | Tragic 2.7% |
| Blackfeet | 0.0 /100 | #294 | Tragic 2.7% |
| Barbadians | 0.0 /100 | #295 | Tragic 2.7% |
| Immigrants from Portugal | 0.0 /100 | #296 | Tragic 2.8% |
| West Indians | 0.0 /100 | #297 | Tragic 2.8% |
Cuban Self-Care Disability Correlation Summary
| Measurement | Cuban Data | Self-Care Disability Data |
| Minimum | 0.21% | 1.1% |
| Maximum | 81.9% | 5.4% |
| Range | 81.6% | 4.3% |
| Mean | 32.2% | 2.7% |
| Median | 28.4% | 2.5% |
| Interquartile 25% (IQ1) | 13.2% | 2.2% |
| Interquartile 75% (IQ3) | 49.5% | 3.0% |
| Interquartile Range (IQR) | 36.3% | 0.80% |
| Standard Deviation (Sample) | 22.3% | 0.82% |
| Standard Deviation (Population) | 22.2% | 0.81% |
Correlation Details
| Cuban Percentile | Sample Size | Self-Care Disability |
[ 0.0% - 0.5% ] 0.21% | 333,351,409 | 2.5% |
[ 0.5% - 1.0% ] 0.69% | 60,412,138 | 2.5% |
[ 1.0% - 1.5% ] 1.21% | 16,817,318 | 2.5% |
[ 1.5% - 2.0% ] 1.70% | 9,817,722 | 2.6% |
[ 2.0% - 2.5% ] 2.24% | 5,657,152 | 2.7% |
[ 2.5% - 3.0% ] 2.73% | 4,779,222 | 2.5% |
[ 3.0% - 3.5% ] 3.24% | 2,349,429 | 2.7% |
[ 3.5% - 4.0% ] 3.73% | 1,875,213 | 2.5% |
[ 4.0% - 4.5% ] 4.22% | 1,151,375 | 2.5% |
[ 4.5% - 5.0% ] 4.71% | 829,044 | 2.8% |
[ 5.0% - 5.5% ] 5.27% | 857,111 | 2.6% |
[ 5.5% - 6.0% ] 5.70% | 723,733 | 2.5% |
[ 6.0% - 6.5% ] 6.28% | 531,097 | 2.7% |
[ 6.5% - 7.0% ] 6.78% | 352,998 | 2.4% |
[ 7.0% - 7.5% ] 7.31% | 458,386 | 2.2% |
[ 7.5% - 8.0% ] 7.75% | 858,741 | 2.3% |
[ 8.0% - 8.5% ] 8.34% | 346,567 | 2.5% |
[ 8.5% - 9.0% ] 8.86% | 331,024 | 2.6% |
[ 9.0% - 9.5% ] 9.27% | 251,121 | 2.5% |
[ 9.5% - 10.0% ] 9.72% | 127,392 | 2.7% |
[ 10.0% - 10.5% ] 10.11% | 282,270 | 2.7% |
[ 10.5% - 11.0% ] 10.76% | 169,217 | 2.0% |
[ 11.0% - 11.5% ] 11.25% | 199,324 | 2.3% |
[ 11.5% - 12.0% ] 11.82% | 84,888 | 2.0% |
[ 12.0% - 12.5% ] 12.15% | 190,194 | 2.1% |
[ 12.5% - 13.0% ] 12.79% | 139,261 | 1.6% |
[ 13.0% - 13.5% ] 13.25% | 253,483 | 2.0% |
[ 13.5% - 14.0% ] 13.75% | 142,462 | 2.8% |
[ 14.0% - 14.5% ] 14.07% | 32,641 | 2.4% |
[ 14.5% - 15.0% ] 14.62% | 100,449 | 1.7% |
[ 15.0% - 15.5% ] 15.14% | 354,114 | 2.8% |
[ 15.5% - 16.0% ] 15.67% | 8,237 | 5.3% |
[ 16.0% - 16.5% ] 16.37% | 55,764 | 1.9% |
[ 16.5% - 17.0% ] 16.65% | 17,876 | 2.9% |
[ 17.0% - 17.5% ] 17.13% | 147,489 | 2.0% |
[ 17.5% - 18.0% ] 17.73% | 84,824 | 1.7% |
[ 18.0% - 18.5% ] 18.15% | 180,995 | 2.9% |
[ 18.5% - 19.0% ] 18.94% | 75,635 | 1.5% |
[ 19.0% - 19.5% ] 19.48% | 13,265 | 2.0% |
[ 19.5% - 20.0% ] 19.81% | 96,744 | 2.5% |
[ 20.0% - 20.5% ] 20.27% | 80,415 | 2.1% |
[ 20.5% - 21.0% ] 20.86% | 125,179 | 2.3% |
[ 21.0% - 21.5% ] 21.40% | 53,076 | 2.2% |
[ 21.5% - 22.0% ] 21.70% | 40,853 | 1.9% |
[ 22.0% - 22.5% ] 22.05% | 77,008 | 3.5% |
[ 23.5% - 24.0% ] 23.67% | 50,571 | 3.2% |
[ 24.5% - 25.0% ] 24.54% | 10,520 | 3.6% |
[ 25.0% - 25.5% ] 25.25% | 123,956 | 3.0% |
[ 25.5% - 26.0% ] 25.70% | 124,904 | 2.7% |
[ 26.0% - 26.5% ] 26.21% | 31,590 | 3.9% |
[ 26.5% - 27.0% ] 26.84% | 56,068 | 2.9% |
[ 27.5% - 28.0% ] 27.92% | 15,184 | 1.1% |
[ 28.0% - 28.5% ] 28.15% | 96,294 | 3.1% |
[ 28.5% - 29.0% ] 28.65% | 81,384 | 2.0% |
[ 29.0% - 29.5% ] 29.11% | 35,969 | 2.1% |
[ 29.5% - 30.0% ] 29.72% | 44,956 | 2.1% |
[ 30.5% - 31.0% ] 30.58% | 70,408 | 2.3% |
[ 31.5% - 32.0% ] 31.84% | 112,692 | 2.4% |
[ 32.0% - 32.5% ] 32.04% | 497,852 | 3.0% |
[ 32.5% - 33.0% ] 32.78% | 150,531 | 2.5% |
[ 33.5% - 34.0% ] 33.61% | 81,319 | 2.6% |
[ 34.0% - 34.5% ] 34.13% | 47,255 | 3.6% |
[ 34.5% - 35.0% ] 34.64% | 78,402 | 2.7% |
[ 35.0% - 35.5% ] 35.19% | 147,444 | 2.2% |
[ 35.5% - 36.0% ] 35.76% | 17,902 | 1.4% |
[ 36.0% - 36.5% ] 36.36% | 23,799 | 3.2% |
[ 37.0% - 37.5% ] 37.36% | 4,106 | 1.9% |
[ 37.5% - 38.0% ] 37.56% | 26,994 | 2.2% |
[ 40.0% - 40.5% ] 40.39% | 40,278 | 2.5% |
[ 42.0% - 42.5% ] 42.36% | 88,933 | 2.5% |
[ 42.5% - 43.0% ] 42.99% | 29,240 | 4.2% |
[ 43.0% - 43.5% ] 43.35% | 76,412 | 1.9% |
[ 43.5% - 44.0% ] 43.83% | 105,481 | 2.2% |
[ 44.0% - 44.5% ] 44.15% | 56,791 | 2.4% |
[ 44.5% - 45.0% ] 44.76% | 45,669 | 3.3% |
[ 45.0% - 45.5% ] 45.18% | 35,705 | 2.6% |
[ 45.5% - 46.0% ] 45.68% | 68,602 | 4.4% |
[ 46.0% - 46.5% ] 46.05% | 33,026 | 4.4% |
[ 48.5% - 49.0% ] 48.64% | 81,858 | 2.7% |
[ 49.5% - 50.0% ] 49.52% | 519 | 1.4% |
[ 50.5% - 51.0% ] 50.74% | 3,400 | 3.7% |
[ 51.5% - 52.0% ] 51.73% | 34,335 | 2.2% |
[ 52.0% - 52.5% ] 52.27% | 13,163 | 1.5% |
[ 52.5% - 53.0% ] 52.97% | 29,530 | 2.6% |
[ 53.5% - 54.0% ] 53.91% | 42,710 | 3.0% |
[ 54.5% - 55.0% ] 54.83% | 34,057 | 2.8% |
[ 55.0% - 55.5% ] 55.44% | 19,399 | 2.5% |
[ 56.5% - 57.0% ] 56.95% | 52,661 | 3.1% |
[ 58.0% - 58.5% ] 58.48% | 43,702 | 3.7% |
[ 60.5% - 61.0% ] 60.80% | 52,101 | 3.6% |
[ 61.5% - 62.0% ] 61.83% | 30,621 | 2.5% |
[ 62.0% - 62.5% ] 62.37% | 13,877 | 2.7% |
[ 62.5% - 63.0% ] 62.57% | 55,241 | 2.5% |
[ 63.5% - 64.0% ] 63.81% | 52,851 | 2.4% |
[ 64.0% - 64.5% ] 64.40% | 53,765 | 3.3% |
[ 64.5% - 65.0% ] 64.80% | 24,597 | 4.6% |
[ 67.0% - 67.5% ] 67.07% | 45,620 | 2.4% |
[ 67.5% - 68.0% ] 67.76% | 104,796 | 3.0% |
[ 68.0% - 68.5% ] 68.14% | 10,725 | 4.4% |
[ 69.0% - 69.5% ] 69.21% | 20,850 | 3.2% |
[ 70.0% - 70.5% ] 70.48% | 53,065 | 4.0% |
[ 70.5% - 71.0% ] 70.69% | 22,815 | 2.3% |
[ 75.0% - 75.5% ] 75.16% | 249,592 | 4.0% |
[ 79.0% - 79.5% ] 79.36% | 42,081 | 5.4% |
[ 80.0% - 80.5% ] 80.06% | 71,088 | 4.5% |
[ 81.5% - 82.0% ] 81.85% | 29,830 | 4.7% |