Cuban Married-couple Households
COMPARE
Cuban
Select to Compare
Married-couple Households
Cuban Married-couple Households
45.4%
MARRIED-COUPLE HOUSEHOLDS
7.7/ 100
METRIC RATING
210th/ 347
METRIC RANK
Cuban Married-couple Households Correlation Chart
The statistical analysis conducted on geographies consisting of 448,946,522 people shows a poor positive correlation between the proportion of Cubans and percentage of married-couple family households in the United States with a correlation coefficient (R) of 0.165 and weighted average of 45.4%. On average, for every 1% (one percent) increase in Cubans within a typical geography, there is an increase of 0.055% in percentage of married-couple family households.
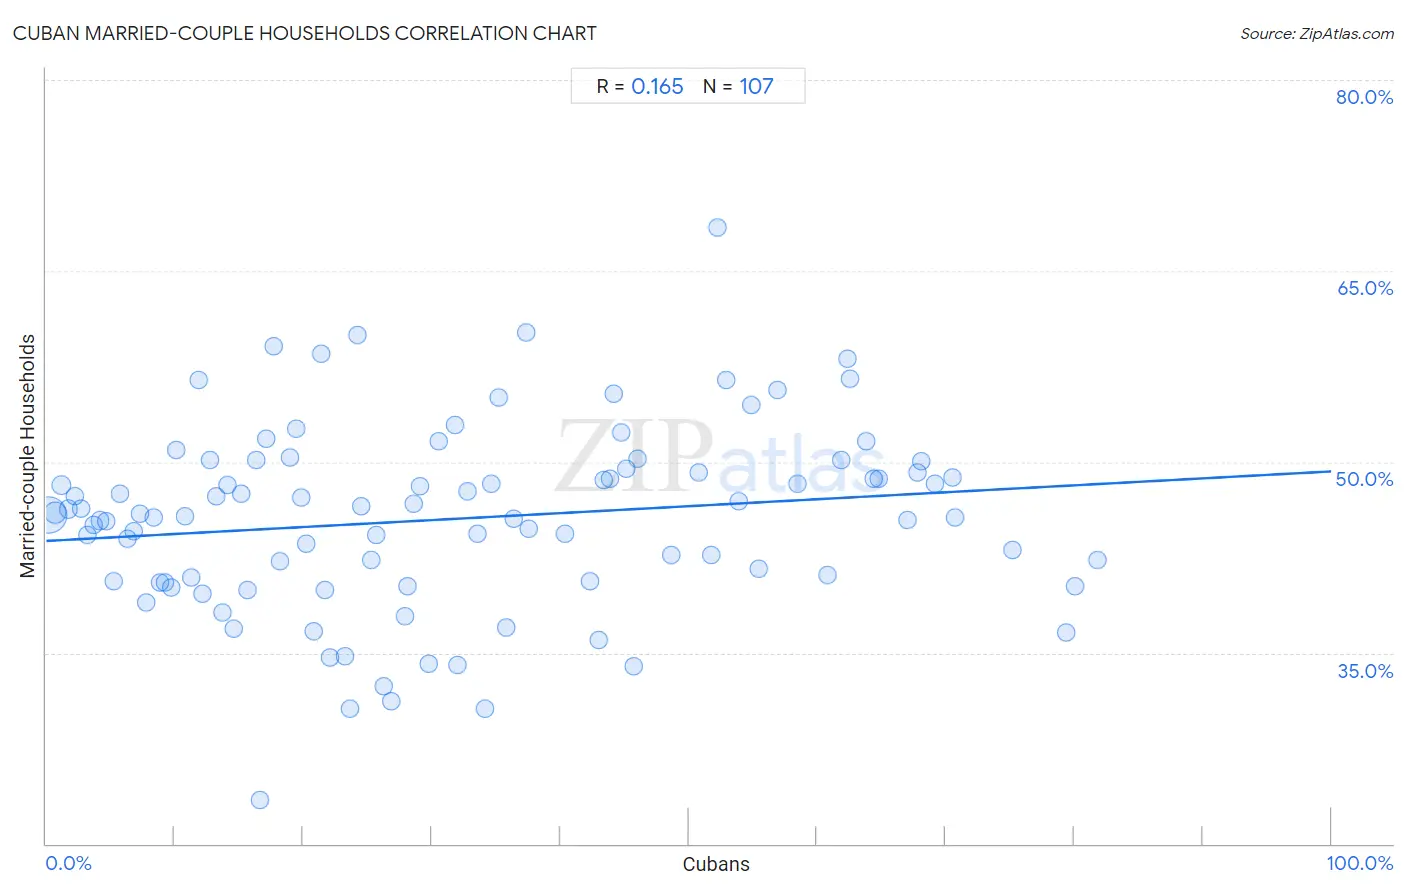
It is essential to understand that the correlation between the percentage of Cubans and percentage of married-couple family households does not imply a direct cause-and-effect relationship. It remains uncertain whether the presence of Cubans influences an upward or downward trend in the level of percentage of married-couple family households within an area, or if Cubans simply ended up residing in those areas with higher or lower levels of percentage of married-couple family households due to other factors.
Demographics Similar to Cubans by Married-couple Households
In terms of married-couple households, the demographic groups most similar to Cubans are Immigrants from Spain (45.3%, a difference of 0.050%), Immigrants from Uzbekistan (45.4%, a difference of 0.090%), Hispanic or Latino (45.4%, a difference of 0.13%), Immigrants from France (45.4%, a difference of 0.14%), and Creek (45.3%, a difference of 0.18%).
| Demographics | Rating | Rank | Married-couple Households |
| Alaska Natives | 13.0 /100 | #203 | Poor 45.6% |
| Aleuts | 12.5 /100 | #204 | Poor 45.6% |
| Nepalese | 11.9 /100 | #205 | Poor 45.6% |
| Uruguayans | 10.4 /100 | #206 | Poor 45.5% |
| Immigrants from France | 8.8 /100 | #207 | Tragic 45.4% |
| Hispanics or Latinos | 8.7 /100 | #208 | Tragic 45.4% |
| Immigrants from Uzbekistan | 8.4 /100 | #209 | Tragic 45.4% |
| Cubans | 7.7 /100 | #210 | Tragic 45.4% |
| Immigrants from Spain | 7.3 /100 | #211 | Tragic 45.3% |
| Creek | 6.4 /100 | #212 | Tragic 45.3% |
| Yakama | 5.8 /100 | #213 | Tragic 45.2% |
| Japanese | 5.7 /100 | #214 | Tragic 45.2% |
| Immigrants from Nepal | 5.6 /100 | #215 | Tragic 45.2% |
| Immigrants from Portugal | 5.6 /100 | #216 | Tragic 45.2% |
| Panamanians | 5.5 /100 | #217 | Tragic 45.2% |
Cuban Married-couple Households Correlation Summary
| Measurement | Cuban Data | Married-couple Households Data |
| Minimum | 0.21% | 23.5% |
| Maximum | 81.9% | 68.4% |
| Range | 81.6% | 45.0% |
| Mean | 31.8% | 45.5% |
| Median | 27.9% | 45.8% |
| Interquartile 25% (IQ1) | 13.2% | 40.6% |
| Interquartile 75% (IQ3) | 48.6% | 49.4% |
| Interquartile Range (IQR) | 35.4% | 8.8% |
| Standard Deviation (Sample) | 22.1% | 7.3% |
| Standard Deviation (Population) | 22.0% | 7.3% |
Correlation Details
| Cuban Percentile | Sample Size | Married-couple Households |
[ 0.0% - 0.5% ] 0.21% | 333,436,815 | 45.8% |
[ 0.5% - 1.0% ] 0.69% | 60,488,254 | 46.0% |
[ 1.0% - 1.5% ] 1.21% | 16,848,206 | 48.2% |
[ 1.5% - 2.0% ] 1.71% | 9,827,372 | 46.3% |
[ 2.0% - 2.5% ] 2.24% | 5,676,719 | 47.3% |
[ 2.5% - 3.0% ] 2.73% | 4,782,897 | 46.3% |
[ 3.0% - 3.5% ] 3.24% | 2,353,903 | 44.2% |
[ 3.5% - 4.0% ] 3.73% | 1,878,620 | 45.0% |
[ 4.0% - 4.5% ] 4.22% | 1,153,265 | 45.4% |
[ 4.5% - 5.0% ] 4.71% | 831,362 | 45.3% |
[ 5.0% - 5.5% ] 5.27% | 845,596 | 40.6% |
[ 5.5% - 6.0% ] 5.70% | 731,667 | 47.5% |
[ 6.0% - 6.5% ] 6.28% | 533,132 | 43.9% |
[ 6.5% - 7.0% ] 6.78% | 354,111 | 44.6% |
[ 7.0% - 7.5% ] 7.31% | 458,652 | 45.9% |
[ 7.5% - 8.0% ] 7.75% | 859,815 | 39.0% |
[ 8.0% - 8.5% ] 8.34% | 350,181 | 45.7% |
[ 8.5% - 9.0% ] 8.85% | 339,486 | 40.5% |
[ 9.0% - 9.5% ] 9.27% | 251,121 | 40.6% |
[ 9.5% - 10.0% ] 9.72% | 127,829 | 40.2% |
[ 10.0% - 10.5% ] 10.11% | 282,270 | 51.0% |
[ 10.5% - 11.0% ] 10.76% | 169,765 | 45.7% |
[ 11.0% - 11.5% ] 11.25% | 199,621 | 40.9% |
[ 11.5% - 12.0% ] 11.82% | 85,803 | 56.4% |
[ 12.0% - 12.5% ] 12.15% | 190,194 | 39.6% |
[ 12.5% - 13.0% ] 12.79% | 139,706 | 50.1% |
[ 13.0% - 13.5% ] 13.25% | 253,483 | 47.3% |
[ 13.5% - 14.0% ] 13.75% | 144,579 | 38.2% |
[ 14.0% - 14.5% ] 14.07% | 32,641 | 48.2% |
[ 14.5% - 15.0% ] 14.62% | 100,510 | 36.8% |
[ 15.0% - 15.5% ] 15.14% | 354,114 | 47.4% |
[ 15.5% - 16.0% ] 15.67% | 8,237 | 40.0% |
[ 16.0% - 16.5% ] 16.37% | 56,734 | 50.1% |
[ 16.5% - 17.0% ] 16.66% | 18,035 | 23.5% |
[ 17.0% - 17.5% ] 17.13% | 148,170 | 51.8% |
[ 17.5% - 18.0% ] 17.73% | 84,991 | 59.1% |
[ 18.0% - 18.5% ] 18.15% | 182,547 | 42.1% |
[ 18.5% - 19.0% ] 18.94% | 75,780 | 50.4% |
[ 19.0% - 19.5% ] 19.48% | 13,265 | 52.6% |
[ 19.5% - 20.0% ] 19.81% | 96,744 | 47.2% |
[ 20.0% - 20.5% ] 20.27% | 80,415 | 43.6% |
[ 20.5% - 21.0% ] 20.86% | 125,179 | 36.7% |
[ 21.0% - 21.5% ] 21.40% | 53,076 | 58.5% |
[ 21.5% - 22.0% ] 21.70% | 40,853 | 39.9% |
[ 22.0% - 22.5% ] 22.05% | 77,008 | 34.6% |
[ 23.0% - 23.5% ] 23.25% | 701 | 34.7% |
[ 23.5% - 24.0% ] 23.67% | 50,571 | 30.6% |
[ 24.0% - 24.5% ] 24.19% | 62 | 60.0% |
[ 24.5% - 25.0% ] 24.55% | 10,609 | 46.5% |
[ 25.0% - 25.5% ] 25.25% | 123,956 | 42.2% |
[ 25.5% - 26.0% ] 25.70% | 126,156 | 44.3% |
[ 26.0% - 26.5% ] 26.23% | 33,851 | 32.4% |
[ 26.5% - 27.0% ] 26.84% | 56,068 | 31.2% |
[ 27.5% - 28.0% ] 27.92% | 15,184 | 37.8% |
[ 28.0% - 28.5% ] 28.15% | 96,294 | 40.2% |
[ 28.5% - 29.0% ] 28.65% | 81,384 | 46.7% |
[ 29.0% - 29.5% ] 29.11% | 35,969 | 48.1% |
[ 29.5% - 30.0% ] 29.72% | 45,100 | 34.2% |
[ 30.5% - 31.0% ] 30.58% | 70,408 | 51.6% |
[ 31.5% - 32.0% ] 31.84% | 112,692 | 52.9% |
[ 32.0% - 32.5% ] 32.04% | 497,852 | 34.1% |
[ 32.5% - 33.0% ] 32.78% | 150,531 | 47.7% |
[ 33.5% - 34.0% ] 33.61% | 81,319 | 44.4% |
[ 34.0% - 34.5% ] 34.13% | 47,255 | 30.6% |
[ 34.5% - 35.0% ] 34.64% | 78,402 | 48.3% |
[ 35.0% - 35.5% ] 35.19% | 147,444 | 55.1% |
[ 35.5% - 36.0% ] 35.76% | 17,902 | 36.9% |
[ 36.0% - 36.5% ] 36.36% | 23,799 | 45.6% |
[ 37.0% - 37.5% ] 37.36% | 4,106 | 60.2% |
[ 37.5% - 38.0% ] 37.56% | 27,084 | 44.7% |
[ 40.0% - 40.5% ] 40.39% | 40,278 | 44.3% |
[ 42.0% - 42.5% ] 42.36% | 88,933 | 40.6% |
[ 42.5% - 43.0% ] 42.98% | 29,570 | 36.0% |
[ 43.0% - 43.5% ] 43.35% | 76,412 | 48.6% |
[ 43.5% - 44.0% ] 43.83% | 105,481 | 48.7% |
[ 44.0% - 44.5% ] 44.15% | 56,791 | 55.3% |
[ 44.5% - 45.0% ] 44.76% | 45,669 | 52.3% |
[ 45.0% - 45.5% ] 45.18% | 35,705 | 49.4% |
[ 45.5% - 46.0% ] 45.68% | 68,602 | 34.0% |
[ 46.0% - 46.5% ] 46.05% | 33,026 | 50.2% |
[ 48.5% - 49.0% ] 48.64% | 81,858 | 42.7% |
[ 50.5% - 51.0% ] 50.74% | 3,400 | 49.1% |
[ 51.5% - 52.0% ] 51.73% | 34,335 | 42.7% |
[ 52.0% - 52.5% ] 52.27% | 13,163 | 68.4% |
[ 52.5% - 53.0% ] 52.97% | 29,530 | 56.5% |
[ 53.5% - 54.0% ] 53.91% | 42,710 | 46.9% |
[ 54.5% - 55.0% ] 54.83% | 34,057 | 54.5% |
[ 55.0% - 55.5% ] 55.44% | 19,399 | 41.7% |
[ 56.5% - 57.0% ] 56.95% | 52,661 | 55.6% |
[ 58.0% - 58.5% ] 58.48% | 43,702 | 48.3% |
[ 60.5% - 61.0% ] 60.80% | 52,101 | 41.1% |
[ 61.5% - 62.0% ] 61.83% | 30,621 | 50.2% |
[ 62.0% - 62.5% ] 62.37% | 13,877 | 58.1% |
[ 62.5% - 63.0% ] 62.57% | 55,241 | 56.5% |
[ 63.5% - 64.0% ] 63.81% | 52,851 | 51.7% |
[ 64.0% - 64.5% ] 64.40% | 53,765 | 48.7% |
[ 64.5% - 65.0% ] 64.80% | 24,597 | 48.6% |
[ 67.0% - 67.5% ] 67.07% | 45,620 | 45.5% |
[ 67.5% - 68.0% ] 67.76% | 104,796 | 49.2% |
[ 68.0% - 68.5% ] 68.14% | 10,725 | 50.1% |
[ 69.0% - 69.5% ] 69.21% | 21,076 | 48.3% |
[ 70.0% - 70.5% ] 70.48% | 53,065 | 48.8% |
[ 70.5% - 71.0% ] 70.69% | 22,815 | 45.7% |
[ 75.0% - 75.5% ] 75.16% | 249,669 | 43.1% |
[ 79.0% - 79.5% ] 79.36% | 42,081 | 36.6% |
[ 80.0% - 80.5% ] 80.06% | 71,088 | 40.3% |
[ 81.5% - 82.0% ] 81.85% | 29,830 | 42.3% |