Carpatho Rusyn Married-Couple Family Poverty

COMPARE

Carpatho Rusyn
Race
Ancestry
AfghanAfricanAlaska NativeAlaskan AthabascanAlbanianAleutAlsatianAmericanApacheArabArapahoArgentineanArmenianAssyrian/Chaldean/SyriacAustralianAustrianBahamianBangladeshiBarbadianBasqueBelgianBelizeanBermudanBhutaneseBlackfeetBolivianBrazilianBritishBritish West IndianBulgarianBurmeseCajunCambodianCanadianCape VerdeanCarpatho RusynCelticCentral AmericanCentral American IndianCherokeeCheyenneChickasawChileanChineseChippewaChoctawColombianColvilleComancheCosta RicanCreeCreekCroatianCrowCubanCypriotCzechCzechoslovakianDanishDelawareDominicanDutchDutch West IndianEastern EuropeanEcuadorianEgyptianEnglishEstonianEthiopianEuropeanFijianFilipinoFinnishFrenchFrench American IndianFrench CanadianGermanGerman RussianGhanaianGreekGuamanian/ChamorroGuatemalanGuyaneseHaitianHmongHonduranHopiHoumaHungarianIcelanderIndian (Asian)IndonesianInupiatIranianIraqiIrishIroquoisIsraeliItalianJamaicanJapaneseJordanianKenyanKiowaKoreanLaotianLatvianLebaneseLiberianLithuanianLumbeeLuxembourgerMacedonianMalaysianMalteseMarshalleseMenomineeMexicanMexican American IndianMongolianMoroccanNative HawaiianNavajoNepaleseNew ZealanderNicaraguanNigerianNorthern EuropeanNorwegianOkinawanOsageOttawaPaiutePakistaniPalestinianPanamanianParaguayanPennsylvania GermanPeruvianPimaPolishPortuguesePotawatomiPuebloPuerto RicanPuget Sound SalishRomanianRussianSalvadoranSamoanScandinavianScotch-IrishScottishSeminoleSenegaleseSerbianShoshoneSierra LeoneanSiouxSlavicSlovakSloveneSomaliSouth AfricanSouth AmericanSouth American IndianSoviet UnionSpaniardSpanishSpanish AmericanSpanish American IndianSri LankanSubsaharan AfricanSudaneseSwedishSwissSyrianTaiwaneseThaiTlingit-HaidaTohono O'OdhamTonganTrinidadian and TobagonianTsimshianTurkishU.S. Virgin IslanderUgandanUkrainianUruguayanUteVenezuelanVietnameseWelshWest IndianYakamaYaquiYugoslavianYumanYup'ikZimbabwean
Immigration
NonimmigrantsImmigrantsAfghanistanAfricaAlbaniaArgentinaArmeniaAsiaAustraliaAustriaBahamasBangladeshBarbadosBelarusBelgiumBelizeBoliviaBosnia and HerzegovinaBrazilBulgariaBurma/MyanmarCabo VerdeCambodiaCameroonCanadaCaribbeanCentral AmericaChileChinaColombiaCongoCosta RicaCroatiaCubaCzechoslovakiaDenmarkDominicaDominican RepublicEastern AfricaEastern AsiaEastern EuropeEcuadorEgyptEl SalvadorEnglandEritreaEthiopiaEuropeFijiFranceGermanyGhanaGreeceGrenadaGuatemalaGuyanaHaitiHondurasHong KongHungaryIndiaIndonesiaIranIraqIrelandIsraelItalyJamaicaJapanJordanKazakhstanKenyaKoreaKuwaitLaosLatin AmericaLatviaLebanonLiberiaLithuaniaMalaysiaMexicoMicronesiaMiddle AfricaMoldovaMoroccoNepalNetherlandsNicaraguaNigeriaNorth AmericaNorth MacedoniaNorthern AfricaNorthern EuropeNorwayOceaniaPakistanPanamaPeruPhilippinesPolandPortugalRomaniaRussiaSaudi ArabiaScotlandSenegalSerbiaSierra LeoneSingaporeSomaliaSouth AfricaSouth AmericaSouth Central AsiaSouth Eastern AsiaSouthern EuropeSpainSri LankaSt. Vincent and the GrenadinesSudanSwedenSwitzerlandSyriaTaiwanThailandTrinidad and TobagoTurkeyUgandaUkraineUruguayUzbekistanVenezuelaVietnamWest IndiesWestern AfricaWestern AsiaWestern EuropeYemenZaireZimbabweAzores
Select to Compare
Race
Ancestry
AfghanAfricanAlaska NativeAlaskan AthabascanAlbanianAleutAlsatianAmericanApacheArabArapahoArgentineanArmenianAssyrian/Chaldean/SyriacAustralianAustrianBahamianBangladeshiBarbadianBasqueBelgianBelizeanBermudanBhutaneseBlackfeetBolivianBrazilianBritishBritish West IndianBulgarianBurmeseCajunCambodianCanadianCape VerdeanCelticCentral AmericanCentral American IndianCherokeeCheyenneChickasawChileanChineseChippewaChoctawColombianColvilleComancheCosta RicanCreeCreekCroatianCrowCubanCypriotCzechCzechoslovakianDanishDelawareDominicanDutchDutch West IndianEastern EuropeanEcuadorianEgyptianEnglishEstonianEthiopianEuropeanFijianFilipinoFinnishFrenchFrench American IndianFrench CanadianGermanGerman RussianGhanaianGreekGuamanian/ChamorroGuatemalanGuyaneseHaitianHmongHonduranHopiHoumaHungarianIcelanderIndian (Asian)IndonesianInupiatIranianIraqiIrishIroquoisIsraeliItalianJamaicanJapaneseJordanianKenyanKiowaKoreanLaotianLatvianLebaneseLiberianLithuanianLumbeeLuxembourgerMacedonianMalaysianMalteseMarshalleseMenomineeMexicanMexican American IndianMongolianMoroccanNative HawaiianNavajoNepaleseNew ZealanderNicaraguanNigerianNorthern EuropeanNorwegianOkinawanOsageOttawaPaiutePakistaniPalestinianPanamanianParaguayanPennsylvania GermanPeruvianPimaPolishPortuguesePotawatomiPuebloPuerto RicanPuget Sound SalishRomanianRussianSalvadoranSamoanScandinavianScotch-IrishScottishSeminoleSenegaleseSerbianShoshoneSierra LeoneanSiouxSlavicSlovakSloveneSomaliSouth AfricanSouth AmericanSouth American IndianSoviet UnionSpaniardSpanishSpanish AmericanSpanish American IndianSri LankanSubsaharan AfricanSudaneseSwedishSwissSyrianTaiwaneseThaiTlingit-HaidaTohono O'OdhamTonganTrinidadian and TobagonianTsimshianTurkishU.S. Virgin IslanderUgandanUkrainianUruguayanUteVenezuelanVietnameseWelshWest IndianYakamaYaquiYugoslavianYumanYup'ikZimbabwean
Immigration
NonimmigrantsImmigrantsAfghanistanAfricaAlbaniaArgentinaArmeniaAsiaAustraliaAustriaBahamasBangladeshBarbadosBelarusBelgiumBelizeBoliviaBosnia and HerzegovinaBrazilBulgariaBurma/MyanmarCabo VerdeCambodiaCameroonCanadaCaribbeanCentral AmericaChileChinaColombiaCongoCosta RicaCroatiaCubaCzechoslovakiaDenmarkDominicaDominican RepublicEastern AfricaEastern AsiaEastern EuropeEcuadorEgyptEl SalvadorEnglandEritreaEthiopiaEuropeFijiFranceGermanyGhanaGreeceGrenadaGuatemalaGuyanaHaitiHondurasHong KongHungaryIndiaIndonesiaIranIraqIrelandIsraelItalyJamaicaJapanJordanKazakhstanKenyaKoreaKuwaitLaosLatin AmericaLatviaLebanonLiberiaLithuaniaMalaysiaMexicoMicronesiaMiddle AfricaMoldovaMoroccoNepalNetherlandsNicaraguaNigeriaNorth AmericaNorth MacedoniaNorthern AfricaNorthern EuropeNorwayOceaniaPakistanPanamaPeruPhilippinesPolandPortugalRomaniaRussiaSaudi ArabiaScotlandSenegalSerbiaSierra LeoneSingaporeSomaliaSouth AfricaSouth AmericaSouth Central AsiaSouth Eastern AsiaSouthern EuropeSpainSri LankaSt. Vincent and the GrenadinesSudanSwedenSwitzerlandSyriaTaiwanThailandTrinidad and TobagoTurkeyUgandaUkraineUruguayUzbekistanVenezuelaVietnamWest IndiesWestern AfricaWestern AsiaWestern EuropeYemenZaireZimbabweAzores
Married-Couple Family Poverty
Income
Poverty
Unemployment
Labor Participation
Family Structure
Vehicle Availability
Education Level
Disability

Carpatho Rusyn Married-Couple Family Poverty
Exceptional

3.9%
POVERTY | MARRIED-COUPLE FAMILIES
100.0/ 100
METRIC RATING
10th/ 347
METRIC RANK

Carpatho Rusyn Married-Couple Family Poverty Correlation Chart

The statistical analysis conducted on geographies consisting of 58,607,667 people shows a weak positive correlation between the proportion of Carpatho Rusyns and poverty level among married-couple families in the United States with a correlation coefficient (R) of 0.274 and weighted average of 3.9%. On average, for every 1% (one percent) increase in Carpatho Rusyns within a typical geography, there is an increase of 0.76% in poverty level among married-couple families.
Carpatho Rusyn Married-Couple Family Poverty
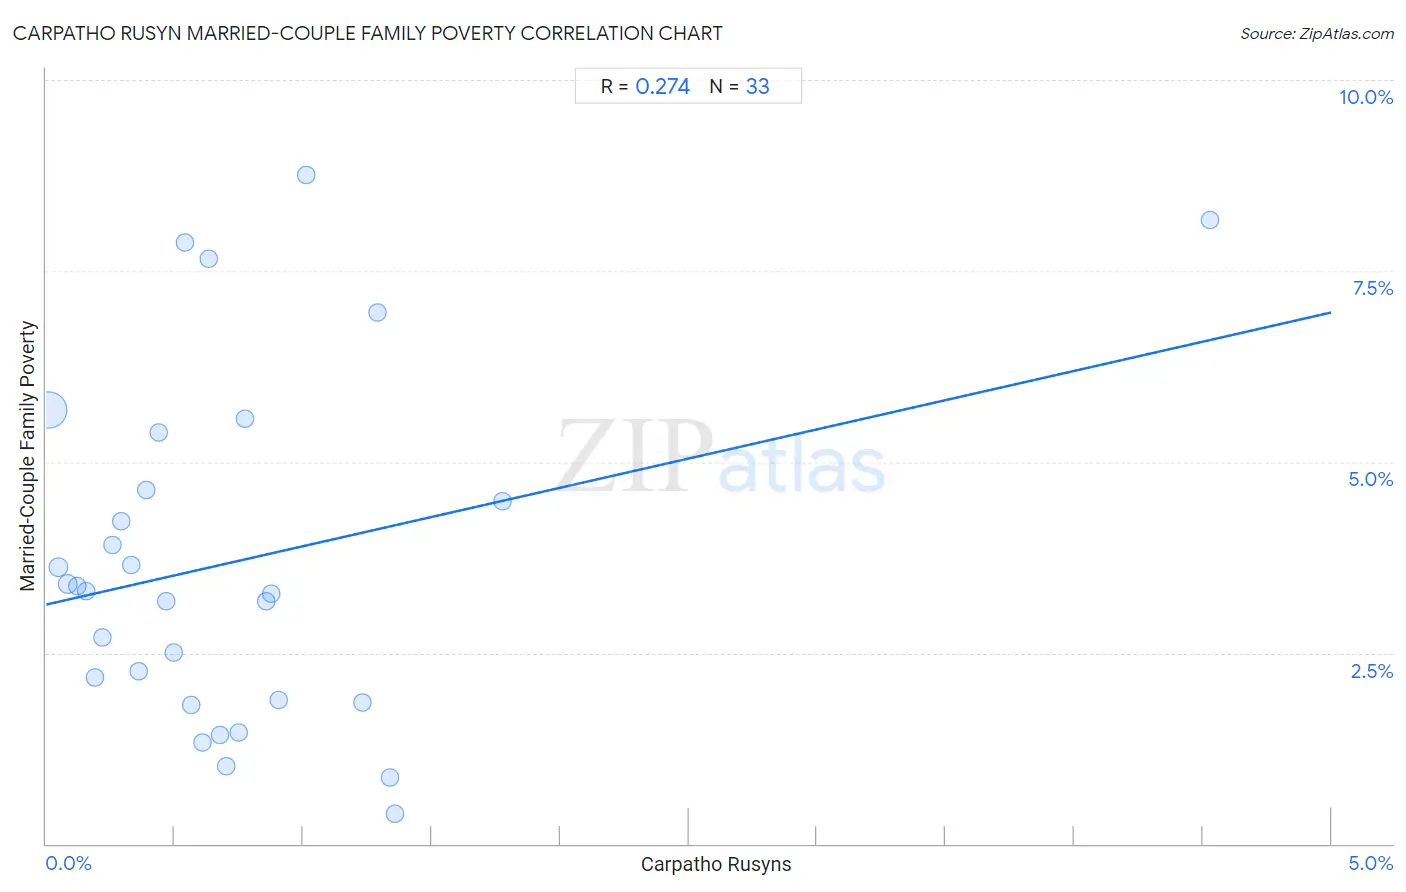
It is essential to understand that the correlation between the percentage of Carpatho Rusyns and poverty level among married-couple families does not imply a direct cause-and-effect relationship. It remains uncertain whether the presence of Carpatho Rusyns influences an upward or downward trend in the level of poverty level among married-couple families within an area, or if Carpatho Rusyns simply ended up residing in those areas with higher or lower levels of poverty level among married-couple families due to other factors.

Demographics Similar to Carpatho Rusyns by Married-Couple Family Poverty

In terms of married-couple family poverty, the demographic groups most similar to Carpatho Rusyns are Croatian (3.9%, a difference of 0.050%), Thai (3.9%, a difference of 0.49%), Lithuanian (4.0%, a difference of 0.51%), Latvian (3.9%, a difference of 1.0%), and Bulgarian (4.0%, a difference of 1.2%).
DemographicsRating | RankMarried-Couple Family Poverty
Norwegians
100.0
/100
|
#3
Exceptional
3.7%
Slovenes
100.0
/100
|
#4
Exceptional
3.8%
Swedes
100.0
/100
|
#5
Exceptional
3.9%
Luxembourgers
100.0
/100
|
#6
Exceptional
3.9%
Latvians
100.0
/100
|
#7
Exceptional
3.9%
Thais
100.0
/100
|
#8
Exceptional
3.9%
Croatians
100.0
/100
|
#9
Exceptional
3.9%
Carpatho Rusyns
100.0
/100
|
#10
Exceptional
3.9%
Lithuanians
100.0
/100
|
#11
Exceptional
4.0%
Bulgarians
100.0
/100
|
#12
Exceptional
4.0%
Czechs
100.0
/100
|
#13
Exceptional
4.0%
Slovaks
100.0
/100
|
#14
Exceptional
4.0%
Poles
100.0
/100
|
#15
Exceptional
4.0%
Germans
100.0
/100
|
#16
Exceptional
4.0%
Filipinos
100.0
/100
|
#17
Exceptional
4.0%

Carpatho Rusyn Married-Couple Family Poverty Correlation Summary

MeasurementCarpatho Rusyn DataMarried-Couple Family Poverty Data
Minimum0.0073%0.39%
Maximum4.5%8.8%
Range4.5%8.4%
Mean0.74%3.7%
Median0.56%3.3%
Interquartile 25% (IQ1)0.27%1.9%
Interquartile 75% (IQ3)0.89%5.0%
Interquartile Range (IQR)0.61%3.2%
Standard Deviation (Sample)0.81%2.2%
Standard Deviation (Population)0.79%2.2%

Correlation Details

Carpatho Rusyn PercentileSample SizeMarried-Couple Family Poverty
[
0.0%
-
0.5%
]
0.0073%
48,793,5035.7%
[
0.0%
-
0.5%
]
0.047%
4,978,0593.6%
[
0.0%
-
0.5%
]
0.083%
1,890,8613.4%
[
0.0%
-
0.5%
]
0.12%
1,142,7703.4%
[
0.0%
-
0.5%
]
0.16%
384,3233.3%
[
0.0%
-
0.5%
]
0.19%
279,7832.2%
[
0.0%
-
0.5%
]
0.22%
289,1222.7%
[
0.0%
-
0.5%
]
0.26%
107,2683.9%
[
0.0%
-
0.5%
]
0.29%
223,5524.2%
[
0.0%
-
0.5%
]
0.33%
97,3003.7%
[
0.0%
-
0.5%
]
0.36%
29,4422.3%
[
0.0%
-
0.5%
]
0.39%
54,7554.6%
[
0.0%
-
0.5%
]
0.44%
21,2025.4%
[
0.0%
-
0.5%
]
0.47%
123,1723.2%
[
0.0%
-
0.5%
]
0.50%
18,8632.5%
[
0.5%
-
1.0%
]
0.54%
10,9507.9%
[
0.5%
-
1.0%
]
0.56%
10,6321.8%
[
0.5%
-
1.0%
]
0.61%
61,0671.3%
[
0.5%
-
1.0%
]
0.63%
12,0427.7%
[
0.5%
-
1.0%
]
0.67%
3,5601.4%
[
0.5%
-
1.0%
]
0.70%
5,5681.0%
[
0.5%
-
1.0%
]
0.75%
17,7481.4%
[
0.5%
-
1.0%
]
0.77%
1,5505.6%
[
0.5%
-
1.0%
]
0.85%
3,2753.2%
[
0.5%
-
1.0%
]
0.87%
20,6913.3%
[
0.5%
-
1.0%
]
0.90%
1,9951.9%
[
1.0%
-
1.5%
]
1.01%
4,6438.8%
[
1.0%
-
1.5%
]
1.23%
9,9851.8%
[
1.0%
-
1.5%
]
1.29%
3,0317.0%
[
1.0%
-
1.5%
]
1.34%
4,4070.87%
[
1.0%
-
1.5%
]
1.36%
1,3260.39%
[
1.5%
-
2.0%
]
1.78%
9574.5%
[
4.5%
-
5.0%
]
4.53%
2658.2%