Carpatho Rusyn GED/Equivalency

COMPARE

Carpatho Rusyn
Race
Ancestry
AfghanAfricanAlaska NativeAlaskan AthabascanAlbanianAleutAlsatianAmericanApacheArabArapahoArgentineanArmenianAssyrian/Chaldean/SyriacAustralianAustrianBahamianBangladeshiBarbadianBasqueBelgianBelizeanBermudanBhutaneseBlackfeetBolivianBrazilianBritishBritish West IndianBulgarianBurmeseCajunCambodianCanadianCape VerdeanCarpatho RusynCelticCentral AmericanCentral American IndianCherokeeCheyenneChickasawChileanChineseChippewaChoctawColombianColvilleComancheCosta RicanCreeCreekCroatianCrowCubanCypriotCzechCzechoslovakianDanishDelawareDominicanDutchDutch West IndianEastern EuropeanEcuadorianEgyptianEnglishEstonianEthiopianEuropeanFijianFilipinoFinnishFrenchFrench American IndianFrench CanadianGermanGerman RussianGhanaianGreekGuamanian/ChamorroGuatemalanGuyaneseHaitianHmongHonduranHopiHoumaHungarianIcelanderIndian (Asian)IndonesianInupiatIranianIraqiIrishIroquoisIsraeliItalianJamaicanJapaneseJordanianKenyanKiowaKoreanLaotianLatvianLebaneseLiberianLithuanianLumbeeLuxembourgerMacedonianMalaysianMalteseMarshalleseMenomineeMexicanMexican American IndianMongolianMoroccanNative HawaiianNavajoNepaleseNew ZealanderNicaraguanNigerianNorthern EuropeanNorwegianOkinawanOsageOttawaPaiutePakistaniPalestinianPanamanianParaguayanPennsylvania GermanPeruvianPimaPolishPortuguesePotawatomiPuebloPuerto RicanPuget Sound SalishRomanianRussianSalvadoranSamoanScandinavianScotch-IrishScottishSeminoleSenegaleseSerbianShoshoneSierra LeoneanSiouxSlavicSlovakSloveneSomaliSouth AfricanSouth AmericanSouth American IndianSoviet UnionSpaniardSpanishSpanish AmericanSpanish American IndianSri LankanSubsaharan AfricanSudaneseSwedishSwissSyrianTaiwaneseThaiTlingit-HaidaTohono O'OdhamTonganTrinidadian and TobagonianTsimshianTurkishU.S. Virgin IslanderUgandanUkrainianUruguayanUteVenezuelanVietnameseWelshWest IndianYakamaYaquiYugoslavianYumanYup'ikZimbabwean
Immigration
NonimmigrantsImmigrantsAfghanistanAfricaAlbaniaArgentinaArmeniaAsiaAustraliaAustriaBahamasBangladeshBarbadosBelarusBelgiumBelizeBoliviaBosnia and HerzegovinaBrazilBulgariaBurma/MyanmarCabo VerdeCambodiaCameroonCanadaCaribbeanCentral AmericaChileChinaColombiaCongoCosta RicaCroatiaCubaCzechoslovakiaDenmarkDominicaDominican RepublicEastern AfricaEastern AsiaEastern EuropeEcuadorEgyptEl SalvadorEnglandEritreaEthiopiaEuropeFijiFranceGermanyGhanaGreeceGrenadaGuatemalaGuyanaHaitiHondurasHong KongHungaryIndiaIndonesiaIranIraqIrelandIsraelItalyJamaicaJapanJordanKazakhstanKenyaKoreaKuwaitLaosLatin AmericaLatviaLebanonLiberiaLithuaniaMalaysiaMexicoMicronesiaMiddle AfricaMoldovaMoroccoNepalNetherlandsNicaraguaNigeriaNorth AmericaNorth MacedoniaNorthern AfricaNorthern EuropeNorwayOceaniaPakistanPanamaPeruPhilippinesPolandPortugalRomaniaRussiaSaudi ArabiaScotlandSenegalSerbiaSierra LeoneSingaporeSomaliaSouth AfricaSouth AmericaSouth Central AsiaSouth Eastern AsiaSouthern EuropeSpainSri LankaSt. Vincent and the GrenadinesSudanSwedenSwitzerlandSyriaTaiwanThailandTrinidad and TobagoTurkeyUgandaUkraineUruguayUzbekistanVenezuelaVietnamWest IndiesWestern AfricaWestern AsiaWestern EuropeYemenZaireZimbabweAzores
Select to Compare
Race
Ancestry
AfghanAfricanAlaska NativeAlaskan AthabascanAlbanianAleutAlsatianAmericanApacheArabArapahoArgentineanArmenianAssyrian/Chaldean/SyriacAustralianAustrianBahamianBangladeshiBarbadianBasqueBelgianBelizeanBermudanBhutaneseBlackfeetBolivianBrazilianBritishBritish West IndianBulgarianBurmeseCajunCambodianCanadianCape VerdeanCelticCentral AmericanCentral American IndianCherokeeCheyenneChickasawChileanChineseChippewaChoctawColombianColvilleComancheCosta RicanCreeCreekCroatianCrowCubanCypriotCzechCzechoslovakianDanishDelawareDominicanDutchDutch West IndianEastern EuropeanEcuadorianEgyptianEnglishEstonianEthiopianEuropeanFijianFilipinoFinnishFrenchFrench American IndianFrench CanadianGermanGerman RussianGhanaianGreekGuamanian/ChamorroGuatemalanGuyaneseHaitianHmongHonduranHopiHoumaHungarianIcelanderIndian (Asian)IndonesianInupiatIranianIraqiIrishIroquoisIsraeliItalianJamaicanJapaneseJordanianKenyanKiowaKoreanLaotianLatvianLebaneseLiberianLithuanianLumbeeLuxembourgerMacedonianMalaysianMalteseMarshalleseMenomineeMexicanMexican American IndianMongolianMoroccanNative HawaiianNavajoNepaleseNew ZealanderNicaraguanNigerianNorthern EuropeanNorwegianOkinawanOsageOttawaPaiutePakistaniPalestinianPanamanianParaguayanPennsylvania GermanPeruvianPimaPolishPortuguesePotawatomiPuebloPuerto RicanPuget Sound SalishRomanianRussianSalvadoranSamoanScandinavianScotch-IrishScottishSeminoleSenegaleseSerbianShoshoneSierra LeoneanSiouxSlavicSlovakSloveneSomaliSouth AfricanSouth AmericanSouth American IndianSoviet UnionSpaniardSpanishSpanish AmericanSpanish American IndianSri LankanSubsaharan AfricanSudaneseSwedishSwissSyrianTaiwaneseThaiTlingit-HaidaTohono O'OdhamTonganTrinidadian and TobagonianTsimshianTurkishU.S. Virgin IslanderUgandanUkrainianUruguayanUteVenezuelanVietnameseWelshWest IndianYakamaYaquiYugoslavianYumanYup'ikZimbabwean
Immigration
NonimmigrantsImmigrantsAfghanistanAfricaAlbaniaArgentinaArmeniaAsiaAustraliaAustriaBahamasBangladeshBarbadosBelarusBelgiumBelizeBoliviaBosnia and HerzegovinaBrazilBulgariaBurma/MyanmarCabo VerdeCambodiaCameroonCanadaCaribbeanCentral AmericaChileChinaColombiaCongoCosta RicaCroatiaCubaCzechoslovakiaDenmarkDominicaDominican RepublicEastern AfricaEastern AsiaEastern EuropeEcuadorEgyptEl SalvadorEnglandEritreaEthiopiaEuropeFijiFranceGermanyGhanaGreeceGrenadaGuatemalaGuyanaHaitiHondurasHong KongHungaryIndiaIndonesiaIranIraqIrelandIsraelItalyJamaicaJapanJordanKazakhstanKenyaKoreaKuwaitLaosLatin AmericaLatviaLebanonLiberiaLithuaniaMalaysiaMexicoMicronesiaMiddle AfricaMoldovaMoroccoNepalNetherlandsNicaraguaNigeriaNorth AmericaNorth MacedoniaNorthern AfricaNorthern EuropeNorwayOceaniaPakistanPanamaPeruPhilippinesPolandPortugalRomaniaRussiaSaudi ArabiaScotlandSenegalSerbiaSierra LeoneSingaporeSomaliaSouth AfricaSouth AmericaSouth Central AsiaSouth Eastern AsiaSouthern EuropeSpainSri LankaSt. Vincent and the GrenadinesSudanSwedenSwitzerlandSyriaTaiwanThailandTrinidad and TobagoTurkeyUgandaUkraineUruguayUzbekistanVenezuelaVietnamWest IndiesWestern AfricaWestern AsiaWestern EuropeYemenZaireZimbabweAzores
GED/Equivalency
Income
Poverty
Unemployment
Labor Participation
Family Structure
Vehicle Availability
Education Level
Disability

Carpatho Rusyn GED/Equivalency
Exceptional

89.1%
GED/EQUIVALENCY
99.9/ 100
METRIC RATING
8th/ 347
METRIC RANK

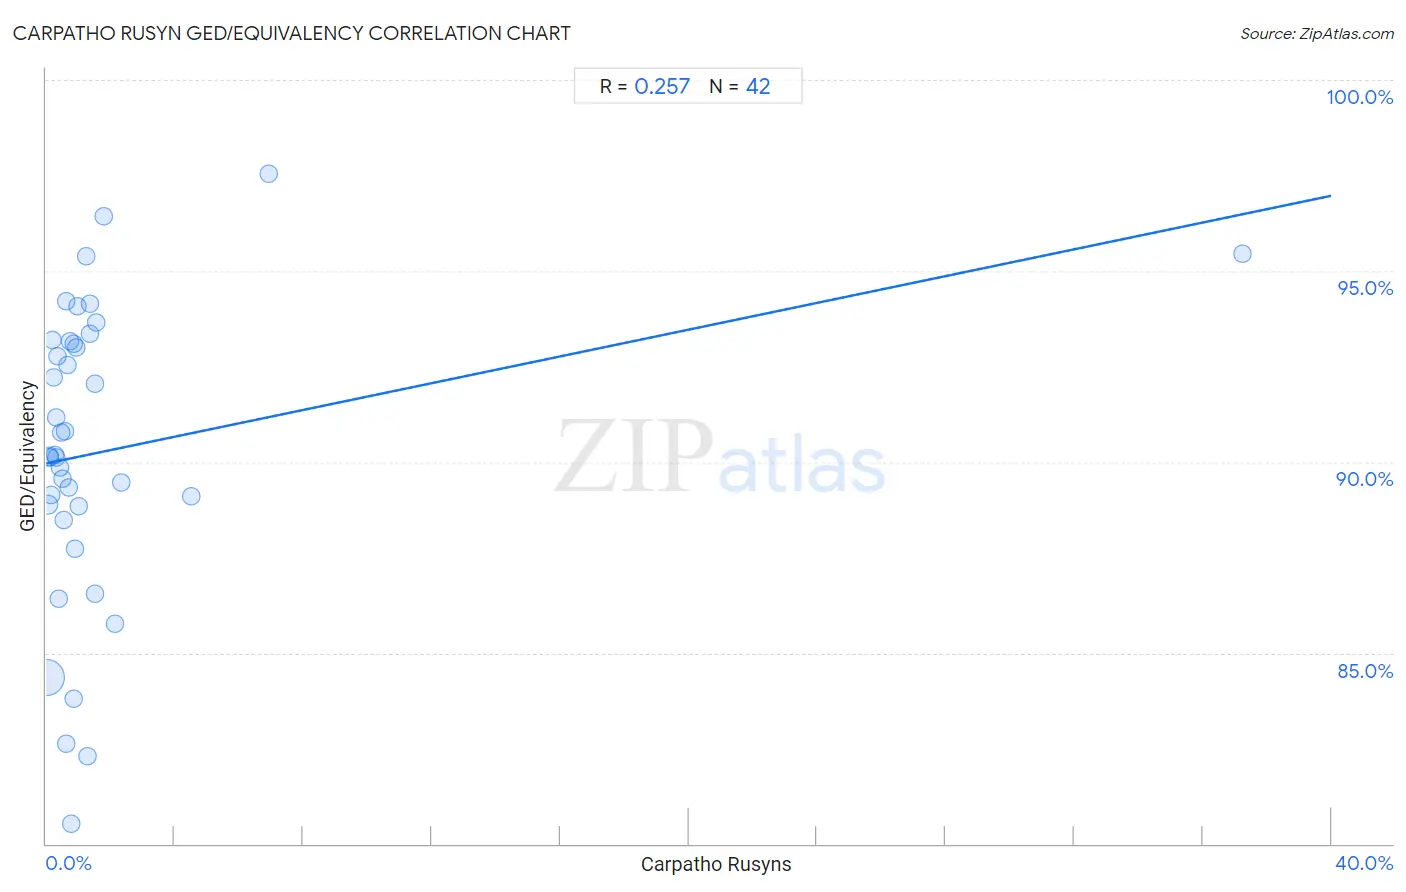
Carpatho Rusyn GED/Equivalency Correlation Chart

The statistical analysis conducted on geographies consisting of 58,871,690 people shows a weak positive correlation between the proportion of Carpatho Rusyns and percentage of population with at least ged/equivalency education in the United States with a correlation coefficient (R) of 0.257 and weighted average of 89.1%. On average, for every 1% (one percent) increase in Carpatho Rusyns within a typical geography, there is an increase of 0.18% in percentage of population with at least ged/equivalency education.
Carpatho Rusyn GED/Equivalency
It is essential to understand that the correlation between the percentage of Carpatho Rusyns and percentage of population with at least ged/equivalency education does not imply a direct cause-and-effect relationship. It remains uncertain whether the presence of Carpatho Rusyns influences an upward or downward trend in the level of percentage of population with at least ged/equivalency education within an area, or if Carpatho Rusyns simply ended up residing in those areas with higher or lower levels of percentage of population with at least ged/equivalency education due to other factors.

Demographics Similar to Carpatho Rusyns by GED/Equivalency

In terms of ged/equivalency, the demographic groups most similar to Carpatho Rusyns are Chinese (89.0%, a difference of 0.020%), Eastern European (89.1%, a difference of 0.050%), Norwegian (89.0%, a difference of 0.070%), Thai (89.1%, a difference of 0.090%), and Bulgarian (89.0%, a difference of 0.10%).
DemographicsRating | RankGED/Equivalency
Immigrants from India
100.0
/100
|
#1
Exceptional
89.7%
Filipinos
100.0
/100
|
#2
Exceptional
89.5%
Immigrants from Singapore
100.0
/100
|
#3
Exceptional
89.3%
Iranians
100.0
/100
|
#4
Exceptional
89.2%
Latvians
100.0
/100
|
#5
Exceptional
89.2%
Thais
100.0
/100
|
#6
Exceptional
89.1%
Eastern Europeans
99.9
/100
|
#7
Exceptional
89.1%
Carpatho Rusyns
99.9
/100
|
#8
Exceptional
89.1%
Chinese
99.9
/100
|
#9
Exceptional
89.0%
Norwegians
99.9
/100
|
#10
Exceptional
89.0%
Bulgarians
99.9
/100
|
#11
Exceptional
89.0%
Lithuanians
99.9
/100
|
#12
Exceptional
88.9%
Immigrants from Iran
99.9
/100
|
#13
Exceptional
88.9%
Cypriots
99.9
/100
|
#14
Exceptional
88.9%
Okinawans
99.9
/100
|
#15
Exceptional
88.9%

Carpatho Rusyn GED/Equivalency Correlation Summary

MeasurementCarpatho Rusyn DataGED/Equivalency Data
Minimum0.0073%80.5%
Maximum37.3%97.5%
Range37.2%17.0%
Mean1.9%90.3%
Median0.73%90.2%
Interquartile 25% (IQ1)0.36%88.8%
Interquartile 75% (IQ3)1.3%93.2%
Interquartile Range (IQR)0.99%4.3%
Standard Deviation (Sample)5.7%3.9%
Standard Deviation (Population)5.7%3.9%

Correlation Details

Carpatho Rusyn PercentileSample SizeGED/Equivalency
[
0.0%
-
0.5%
]
0.0073%
48,800,22784.3%
[
0.0%
-
0.5%
]
0.047%
4,982,61588.9%
[
0.0%
-
0.5%
]
0.083%
1,908,54490.1%
[
0.0%
-
0.5%
]
0.12%
1,197,43990.1%
[
0.0%
-
0.5%
]
0.16%
397,98789.1%
[
0.0%
-
0.5%
]
0.19%
325,32793.2%
[
0.0%
-
0.5%
]
0.22%
312,93492.2%
[
0.0%
-
0.5%
]
0.26%
124,55290.2%
[
0.0%
-
0.5%
]
0.29%
231,20791.2%
[
0.0%
-
0.5%
]
0.33%
104,92990.1%
[
0.0%
-
0.5%
]
0.36%
53,87492.8%
[
0.0%
-
0.5%
]
0.39%
54,75586.4%
[
0.0%
-
0.5%
]
0.43%
30,20089.8%
[
0.0%
-
0.5%
]
0.47%
123,17290.8%
[
0.0%
-
0.5%
]
0.50%
28,08289.6%
[
0.5%
-
1.0%
]
0.54%
10,95088.5%
[
0.5%
-
1.0%
]
0.56%
10,63290.8%
[
0.5%
-
1.0%
]
0.61%
61,06794.2%
[
0.5%
-
1.0%
]
0.63%
12,04282.6%
[
0.5%
-
1.0%
]
0.67%
3,56092.5%
[
0.5%
-
1.0%
]
0.71%
8,50389.3%
[
0.5%
-
1.0%
]
0.75%
17,74893.2%
[
0.5%
-
1.0%
]
0.77%
1,55080.5%
[
0.5%
-
1.0%
]
0.85%
3,27583.8%
[
0.5%
-
1.0%
]
0.88%
20,91493.1%
[
0.5%
-
1.0%
]
0.91%
3,85387.7%
[
0.5%
-
1.0%
]
0.95%
5,58493.0%
[
0.5%
-
1.0%
]
0.97%
61794.1%
[
1.0%
-
1.5%
]
1.01%
7,40888.8%
[
1.0%
-
1.5%
]
1.23%
9,98595.4%
[
1.0%
-
1.5%
]
1.29%
3,03182.3%
[
1.0%
-
1.5%
]
1.34%
7,51494.1%
[
1.0%
-
1.5%
]
1.36%
1,84193.3%
[
1.5%
-
2.0%
]
1.50%
46692.0%
[
1.5%
-
2.0%
]
1.53%
72186.5%
[
1.5%
-
2.0%
]
1.56%
83193.7%
[
1.5%
-
2.0%
]
1.78%
95796.4%
[
2.0%
-
2.5%
]
2.15%
32585.8%
[
2.0%
-
2.5%
]
2.35%
8589.5%
[
4.5%
-
5.0%
]
4.53%
26589.1%
[
6.5%
-
7.0%
]
6.93%
1,91897.5%
[
37.0%
-
37.5%
]
37.25%
20495.5%