Carpatho Rusyn 2 or more Vehicles in Household
COMPARE
Carpatho Rusyn
Select to Compare
2 or more Vehicles in Household
Carpatho Rusyn 2 or more Vehicles in Household
54.4%
2+ VEHICLES AVAILABLE
16.2/ 100
METRIC RATING
198th/ 347
METRIC RANK
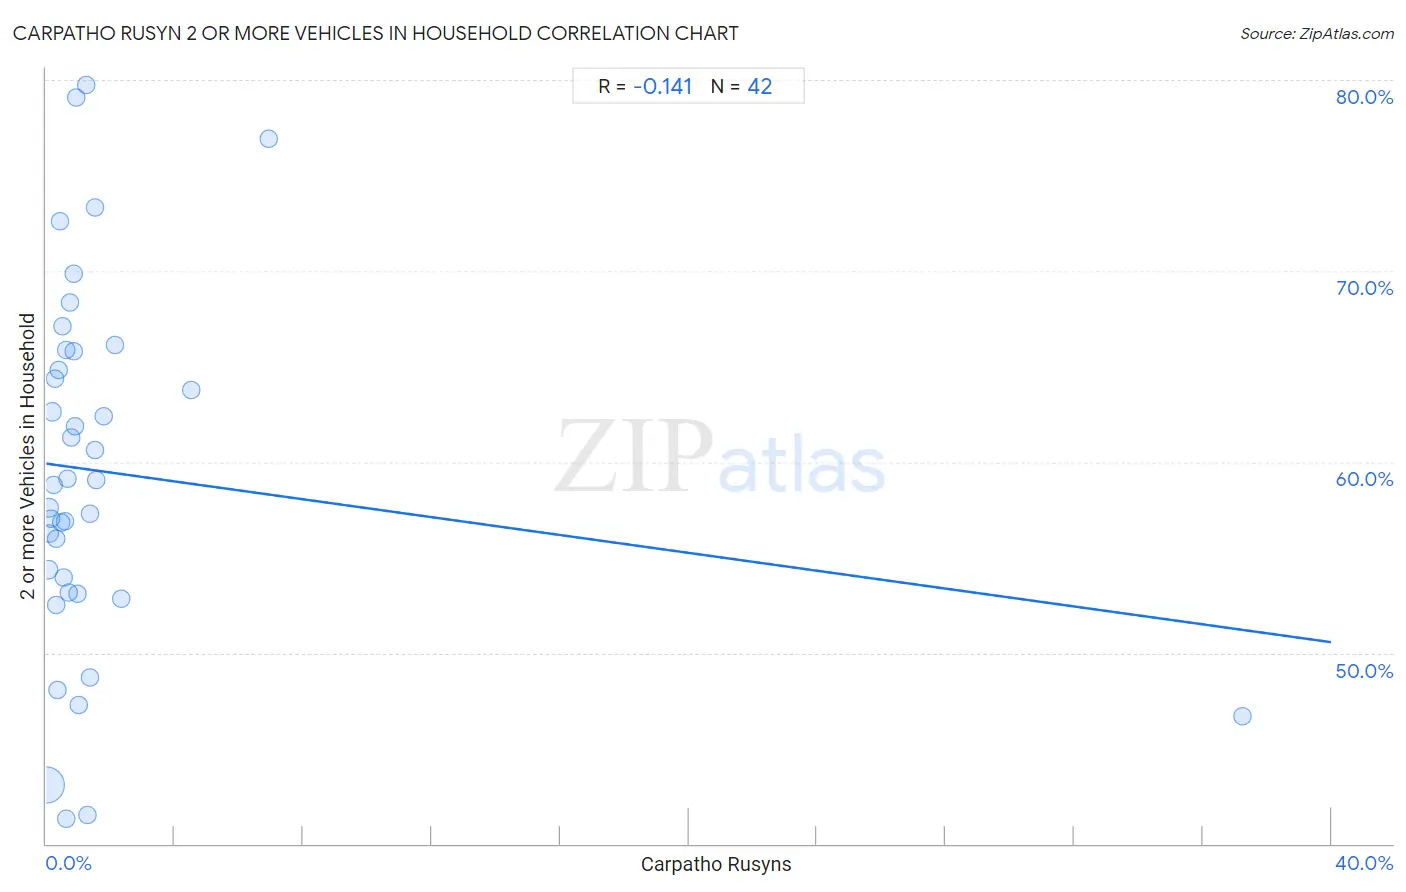
Carpatho Rusyn 2 or more Vehicles in Household Correlation Chart
The statistical analysis conducted on geographies consisting of 58,871,690 people shows a poor negative correlation between the proportion of Carpatho Rusyns and percentage of households with 2 or more vehicles available in the United States with a correlation coefficient (R) of -0.141 and weighted average of 54.4%. On average, for every 1% (one percent) increase in Carpatho Rusyns within a typical geography, there is a decrease of 0.23% in percentage of households with 2 or more vehicles available.
It is essential to understand that the correlation between the percentage of Carpatho Rusyns and percentage of households with 2 or more vehicles available does not imply a direct cause-and-effect relationship. It remains uncertain whether the presence of Carpatho Rusyns influences an upward or downward trend in the level of percentage of households with 2 or more vehicles available within an area, or if Carpatho Rusyns simply ended up residing in those areas with higher or lower levels of percentage of households with 2 or more vehicles available due to other factors.
Demographics Similar to Carpatho Rusyns by 2 or more Vehicles in Household
In terms of 2 or more vehicles in household, the demographic groups most similar to Carpatho Rusyns are Immigrants from Norway (54.4%, a difference of 0.030%), Houma (54.4%, a difference of 0.030%), Immigrants from Italy (54.4%, a difference of 0.060%), Argentinean (54.5%, a difference of 0.090%), and Immigrants from North Macedonia (54.4%, a difference of 0.11%).
| Demographics | Rating | Rank | 2 or more Vehicles in Household |
| Immigrants | 25.0 /100 | #191 | Fair 54.7% |
| Immigrants from Romania | 23.8 /100 | #192 | Fair 54.7% |
| Immigrants from Japan | 23.4 /100 | #193 | Fair 54.7% |
| Central Americans | 23.0 /100 | #194 | Fair 54.7% |
| Iroquois | 22.6 /100 | #195 | Fair 54.7% |
| Immigrants from Poland | 19.3 /100 | #196 | Poor 54.6% |
| Argentineans | 17.5 /100 | #197 | Poor 54.5% |
| Carpatho Rusyns | 16.2 /100 | #198 | Poor 54.4% |
| Immigrants from Norway | 15.9 /100 | #199 | Poor 54.4% |
| Houma | 15.8 /100 | #200 | Poor 54.4% |
| Immigrants from Italy | 15.5 /100 | #201 | Poor 54.4% |
| Immigrants from North Macedonia | 14.9 /100 | #202 | Poor 54.4% |
| Immigrants from Peru | 14.3 /100 | #203 | Poor 54.4% |
| Immigrants from Belgium | 13.7 /100 | #204 | Poor 54.3% |
| Cheyenne | 13.6 /100 | #205 | Poor 54.3% |
Carpatho Rusyn 2 or more Vehicles in Household Correlation Summary
| Measurement | Carpatho Rusyn Data | 2 or more Vehicles in Household Data |
| Minimum | 0.0073% | 41.3% |
| Maximum | 37.3% | 79.7% |
| Range | 37.2% | 38.5% |
| Mean | 1.9% | 59.5% |
| Median | 0.73% | 58.9% |
| Interquartile 25% (IQ1) | 0.36% | 53.2% |
| Interquartile 75% (IQ3) | 1.3% | 65.8% |
| Interquartile Range (IQR) | 0.99% | 12.6% |
| Standard Deviation (Sample) | 5.7% | 9.5% |
| Standard Deviation (Population) | 5.7% | 9.4% |
Correlation Details
| Carpatho Rusyn Percentile | Sample Size | 2 or more Vehicles in Household |
[ 0.0% - 0.5% ] 0.0073% | 48,800,227 | 43.1% |
[ 0.0% - 0.5% ] 0.047% | 4,982,615 | 54.4% |
[ 0.0% - 0.5% ] 0.083% | 1,908,544 | 57.6% |
[ 0.0% - 0.5% ] 0.12% | 1,197,439 | 56.3% |
[ 0.0% - 0.5% ] 0.16% | 397,987 | 57.0% |
[ 0.0% - 0.5% ] 0.19% | 325,327 | 62.6% |
[ 0.0% - 0.5% ] 0.22% | 312,934 | 58.8% |
[ 0.0% - 0.5% ] 0.26% | 124,552 | 64.3% |
[ 0.0% - 0.5% ] 0.29% | 231,207 | 52.5% |
[ 0.0% - 0.5% ] 0.33% | 104,929 | 56.0% |
[ 0.0% - 0.5% ] 0.36% | 53,874 | 48.0% |
[ 0.0% - 0.5% ] 0.39% | 54,755 | 64.8% |
[ 0.0% - 0.5% ] 0.43% | 30,200 | 72.6% |
[ 0.0% - 0.5% ] 0.47% | 123,172 | 56.8% |
[ 0.0% - 0.5% ] 0.50% | 28,082 | 67.1% |
[ 0.5% - 1.0% ] 0.54% | 10,950 | 54.0% |
[ 0.5% - 1.0% ] 0.56% | 10,632 | 56.9% |
[ 0.5% - 1.0% ] 0.61% | 61,067 | 65.9% |
[ 0.5% - 1.0% ] 0.63% | 12,042 | 41.3% |
[ 0.5% - 1.0% ] 0.67% | 3,560 | 59.1% |
[ 0.5% - 1.0% ] 0.71% | 8,503 | 53.2% |
[ 0.5% - 1.0% ] 0.75% | 17,748 | 68.3% |
[ 0.5% - 1.0% ] 0.77% | 1,550 | 61.3% |
[ 0.5% - 1.0% ] 0.85% | 3,275 | 65.8% |
[ 0.5% - 1.0% ] 0.88% | 20,914 | 69.9% |
[ 0.5% - 1.0% ] 0.91% | 3,853 | 61.8% |
[ 0.5% - 1.0% ] 0.95% | 5,584 | 79.1% |
[ 0.5% - 1.0% ] 0.97% | 617 | 53.1% |
[ 1.0% - 1.5% ] 1.01% | 7,408 | 47.2% |
[ 1.0% - 1.5% ] 1.23% | 9,985 | 79.7% |
[ 1.0% - 1.5% ] 1.29% | 3,031 | 41.5% |
[ 1.0% - 1.5% ] 1.34% | 7,514 | 48.7% |
[ 1.0% - 1.5% ] 1.36% | 1,841 | 57.3% |
[ 1.5% - 2.0% ] 1.50% | 466 | 60.6% |
[ 1.5% - 2.0% ] 1.53% | 721 | 73.3% |
[ 1.5% - 2.0% ] 1.56% | 831 | 59.1% |
[ 1.5% - 2.0% ] 1.78% | 957 | 62.4% |
[ 2.0% - 2.5% ] 2.15% | 325 | 66.1% |
[ 2.0% - 2.5% ] 2.35% | 85 | 52.8% |
[ 4.5% - 5.0% ] 4.53% | 265 | 63.8% |
[ 6.5% - 7.0% ] 6.93% | 1,918 | 77.0% |
[ 37.0% - 37.5% ] 37.25% | 204 | 46.7% |