British West Indian Self-Care Disability
COMPARE
British West Indian
Select to Compare
Self-Care Disability
British West Indian Self-Care Disability
2.8%
SELF-CARE DISABILITY
0.0/ 100
METRIC RATING
310th/ 347
METRIC RANK
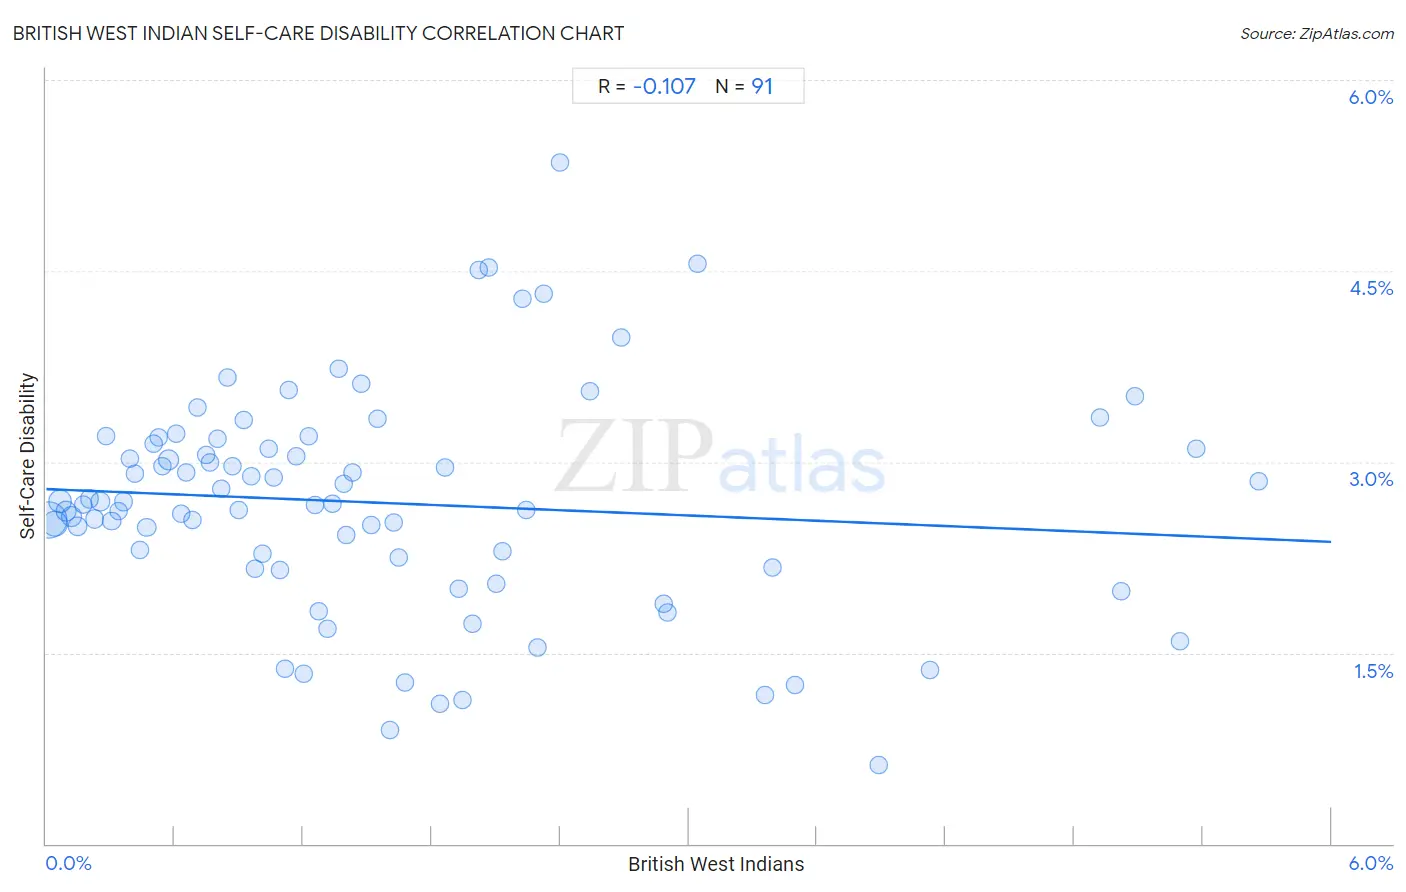
British West Indian Self-Care Disability Correlation Chart
The statistical analysis conducted on geographies consisting of 152,617,328 people shows a poor negative correlation between the proportion of British West Indians and percentage of population with self-care disability in the United States with a correlation coefficient (R) of -0.107 and weighted average of 2.8%. On average, for every 1% (one percent) increase in British West Indians within a typical geography, there is a decrease of 0.069% in percentage of population with self-care disability.
It is essential to understand that the correlation between the percentage of British West Indians and percentage of population with self-care disability does not imply a direct cause-and-effect relationship. It remains uncertain whether the presence of British West Indians influences an upward or downward trend in the level of percentage of population with self-care disability within an area, or if British West Indians simply ended up residing in those areas with higher or lower levels of percentage of population with self-care disability due to other factors.
Demographics Similar to British West Indians by Self-Care Disability
In terms of self-care disability, the demographic groups most similar to British West Indians are Puget Sound Salish (2.8%, a difference of 0.070%), Bangladeshi (2.8%, a difference of 0.10%), Immigrants from Grenada (2.8%, a difference of 0.25%), Immigrants from Caribbean (2.8%, a difference of 0.26%), and Spanish American (2.8%, a difference of 0.30%).
| Demographics | Rating | Rank | Self-Care Disability |
| Immigrants from Belize | 0.0 /100 | #303 | Tragic 2.8% |
| Cree | 0.0 /100 | #304 | Tragic 2.8% |
| Immigrants from West Indies | 0.0 /100 | #305 | Tragic 2.8% |
| Aleuts | 0.0 /100 | #306 | Tragic 2.8% |
| Natives/Alaskans | 0.0 /100 | #307 | Tragic 2.8% |
| Immigrants from Grenada | 0.0 /100 | #308 | Tragic 2.8% |
| Bangladeshis | 0.0 /100 | #309 | Tragic 2.8% |
| British West Indians | 0.0 /100 | #310 | Tragic 2.8% |
| Puget Sound Salish | 0.0 /100 | #311 | Tragic 2.8% |
| Immigrants from Caribbean | 0.0 /100 | #312 | Tragic 2.8% |
| Spanish Americans | 0.0 /100 | #313 | Tragic 2.8% |
| Creek | 0.0 /100 | #314 | Tragic 2.8% |
| Immigrants from Cuba | 0.0 /100 | #315 | Tragic 2.8% |
| Menominee | 0.0 /100 | #316 | Tragic 2.8% |
| Immigrants from Dominica | 0.0 /100 | #317 | Tragic 2.8% |
British West Indian Self-Care Disability Correlation Summary
| Measurement | British West Indian Data | Self-Care Disability Data |
| Minimum | 0.011% | 0.62% |
| Maximum | 5.7% | 5.4% |
| Range | 5.6% | 4.7% |
| Mean | 1.6% | 2.7% |
| Median | 1.2% | 2.7% |
| Interquartile 25% (IQ1) | 0.61% | 2.2% |
| Interquartile 75% (IQ3) | 2.1% | 3.1% |
| Interquartile Range (IQR) | 1.5% | 0.97% |
| Standard Deviation (Sample) | 1.3% | 0.87% |
| Standard Deviation (Population) | 1.3% | 0.86% |
Correlation Details
| British West Indian Percentile | Sample Size | Self-Care Disability |
[ 0.0% - 0.5% ] 0.011% | 60,141,745 | 2.5% |
[ 0.0% - 0.5% ] 0.039% | 24,579,479 | 2.5% |
[ 0.0% - 0.5% ] 0.065% | 15,838,007 | 2.7% |
[ 0.0% - 0.5% ] 0.093% | 8,699,139 | 2.6% |
[ 0.0% - 0.5% ] 0.12% | 6,253,677 | 2.6% |
[ 0.0% - 0.5% ] 0.15% | 3,659,260 | 2.5% |
[ 0.0% - 0.5% ] 0.17% | 2,732,814 | 2.7% |
[ 0.0% - 0.5% ] 0.20% | 3,229,227 | 2.7% |
[ 0.0% - 0.5% ] 0.23% | 2,447,371 | 2.6% |
[ 0.0% - 0.5% ] 0.25% | 1,709,967 | 2.7% |
[ 0.0% - 0.5% ] 0.28% | 1,158,447 | 3.2% |
[ 0.0% - 0.5% ] 0.31% | 1,562,920 | 2.5% |
[ 0.0% - 0.5% ] 0.34% | 1,158,808 | 2.6% |
[ 0.0% - 0.5% ] 0.36% | 1,409,129 | 2.7% |
[ 0.0% - 0.5% ] 0.39% | 802,630 | 3.0% |
[ 0.0% - 0.5% ] 0.42% | 741,723 | 2.9% |
[ 0.0% - 0.5% ] 0.44% | 415,486 | 2.3% |
[ 0.0% - 0.5% ] 0.47% | 584,315 | 2.5% |
[ 0.5% - 1.0% ] 0.50% | 476,700 | 3.1% |
[ 0.5% - 1.0% ] 0.52% | 331,863 | 3.2% |
[ 0.5% - 1.0% ] 0.54% | 344,056 | 3.0% |
[ 0.5% - 1.0% ] 0.57% | 8,845,087 | 3.0% |
[ 0.5% - 1.0% ] 0.61% | 455,332 | 3.2% |
[ 0.5% - 1.0% ] 0.63% | 254,639 | 2.6% |
[ 0.5% - 1.0% ] 0.65% | 256,807 | 2.9% |
[ 0.5% - 1.0% ] 0.69% | 242,475 | 2.5% |
[ 0.5% - 1.0% ] 0.71% | 171,871 | 3.4% |
[ 0.5% - 1.0% ] 0.74% | 388,738 | 3.1% |
[ 0.5% - 1.0% ] 0.77% | 238,911 | 3.0% |
[ 0.5% - 1.0% ] 0.80% | 168,947 | 3.2% |
[ 0.5% - 1.0% ] 0.82% | 149,233 | 2.8% |
[ 0.5% - 1.0% ] 0.85% | 49,702 | 3.7% |
[ 0.5% - 1.0% ] 0.87% | 137,333 | 3.0% |
[ 0.5% - 1.0% ] 0.90% | 72,026 | 2.6% |
[ 0.5% - 1.0% ] 0.92% | 59,278 | 3.3% |
[ 0.5% - 1.0% ] 0.96% | 157,080 | 2.9% |
[ 0.5% - 1.0% ] 0.98% | 86,863 | 2.2% |
[ 1.0% - 1.5% ] 1.01% | 156,967 | 2.3% |
[ 1.0% - 1.5% ] 1.04% | 151,206 | 3.1% |
[ 1.0% - 1.5% ] 1.06% | 184,841 | 2.9% |
[ 1.0% - 1.5% ] 1.09% | 47,653 | 2.1% |
[ 1.0% - 1.5% ] 1.11% | 13,186 | 1.4% |
[ 1.0% - 1.5% ] 1.13% | 13,586 | 3.6% |
[ 1.0% - 1.5% ] 1.17% | 81,369 | 3.0% |
[ 1.0% - 1.5% ] 1.20% | 49,688 | 1.3% |
[ 1.0% - 1.5% ] 1.23% | 93,952 | 3.2% |
[ 1.0% - 1.5% ] 1.26% | 153,623 | 2.7% |
[ 1.0% - 1.5% ] 1.27% | 37,866 | 1.8% |
[ 1.0% - 1.5% ] 1.31% | 21,595 | 1.7% |
[ 1.0% - 1.5% ] 1.34% | 11,452 | 2.7% |
[ 1.0% - 1.5% ] 1.37% | 12,234 | 3.7% |
[ 1.0% - 1.5% ] 1.39% | 36,471 | 2.8% |
[ 1.0% - 1.5% ] 1.40% | 84,111 | 2.4% |
[ 1.0% - 1.5% ] 1.43% | 73,987 | 2.9% |
[ 1.0% - 1.5% ] 1.47% | 83,165 | 3.6% |
[ 1.5% - 2.0% ] 1.52% | 44,267 | 2.5% |
[ 1.5% - 2.0% ] 1.55% | 43,148 | 3.3% |
[ 1.5% - 2.0% ] 1.60% | 11,165 | 0.89% |
[ 1.5% - 2.0% ] 1.62% | 96,164 | 2.5% |
[ 1.5% - 2.0% ] 1.65% | 20,442 | 2.2% |
[ 1.5% - 2.0% ] 1.67% | 14,640 | 1.3% |
[ 1.5% - 2.0% ] 1.84% | 272 | 1.1% |
[ 1.5% - 2.0% ] 1.86% | 101,222 | 3.0% |
[ 1.5% - 2.0% ] 1.93% | 9,285 | 2.0% |
[ 1.5% - 2.0% ] 1.94% | 4,734 | 1.1% |
[ 1.5% - 2.0% ] 1.99% | 62,373 | 1.7% |
[ 2.0% - 2.5% ] 2.02% | 8,725 | 4.5% |
[ 2.0% - 2.5% ] 2.07% | 8,277 | 4.5% |
[ 2.0% - 2.5% ] 2.10% | 58,476 | 2.0% |
[ 2.0% - 2.5% ] 2.13% | 1,594 | 2.3% |
[ 2.0% - 2.5% ] 2.22% | 15,390 | 4.3% |
[ 2.0% - 2.5% ] 2.24% | 1,025 | 2.6% |
[ 2.0% - 2.5% ] 2.29% | 2,703 | 1.5% |
[ 2.0% - 2.5% ] 2.32% | 55,336 | 4.3% |
[ 2.0% - 2.5% ] 2.40% | 24,994 | 5.4% |
[ 2.5% - 3.0% ] 2.54% | 203,405 | 3.6% |
[ 2.5% - 3.0% ] 2.68% | 410 | 4.0% |
[ 2.5% - 3.0% ] 2.89% | 797 | 1.9% |
[ 2.5% - 3.0% ] 2.90% | 4,139 | 1.8% |
[ 3.0% - 3.5% ] 3.04% | 50,744 | 4.6% |
[ 3.0% - 3.5% ] 3.36% | 1,459 | 1.2% |
[ 3.0% - 3.5% ] 3.39% | 101,053 | 2.2% |
[ 3.0% - 3.5% ] 3.50% | 6,408 | 1.2% |
[ 3.5% - 4.0% ] 3.89% | 1,879 | 0.62% |
[ 4.0% - 4.5% ] 4.13% | 4,336 | 1.4% |
[ 4.5% - 5.0% ] 4.92% | 84,006 | 3.3% |
[ 5.0% - 5.5% ] 5.02% | 100,082 | 2.0% |
[ 5.0% - 5.5% ] 5.08% | 69,131 | 3.5% |
[ 5.0% - 5.5% ] 5.29% | 378 | 1.6% |
[ 5.0% - 5.5% ] 5.37% | 8,326 | 3.1% |
[ 5.5% - 6.0% ] 5.66% | 78,506 | 2.9% |