British West Indian Married-Couple Family Poverty
COMPARE
British West Indian
Select to Compare
Married-Couple Family Poverty
British West Indian Married-Couple Family Poverty
7.1%
POVERTY | MARRIED-COUPLE FAMILIES
0.0/ 100
METRIC RATING
314th/ 347
METRIC RANK
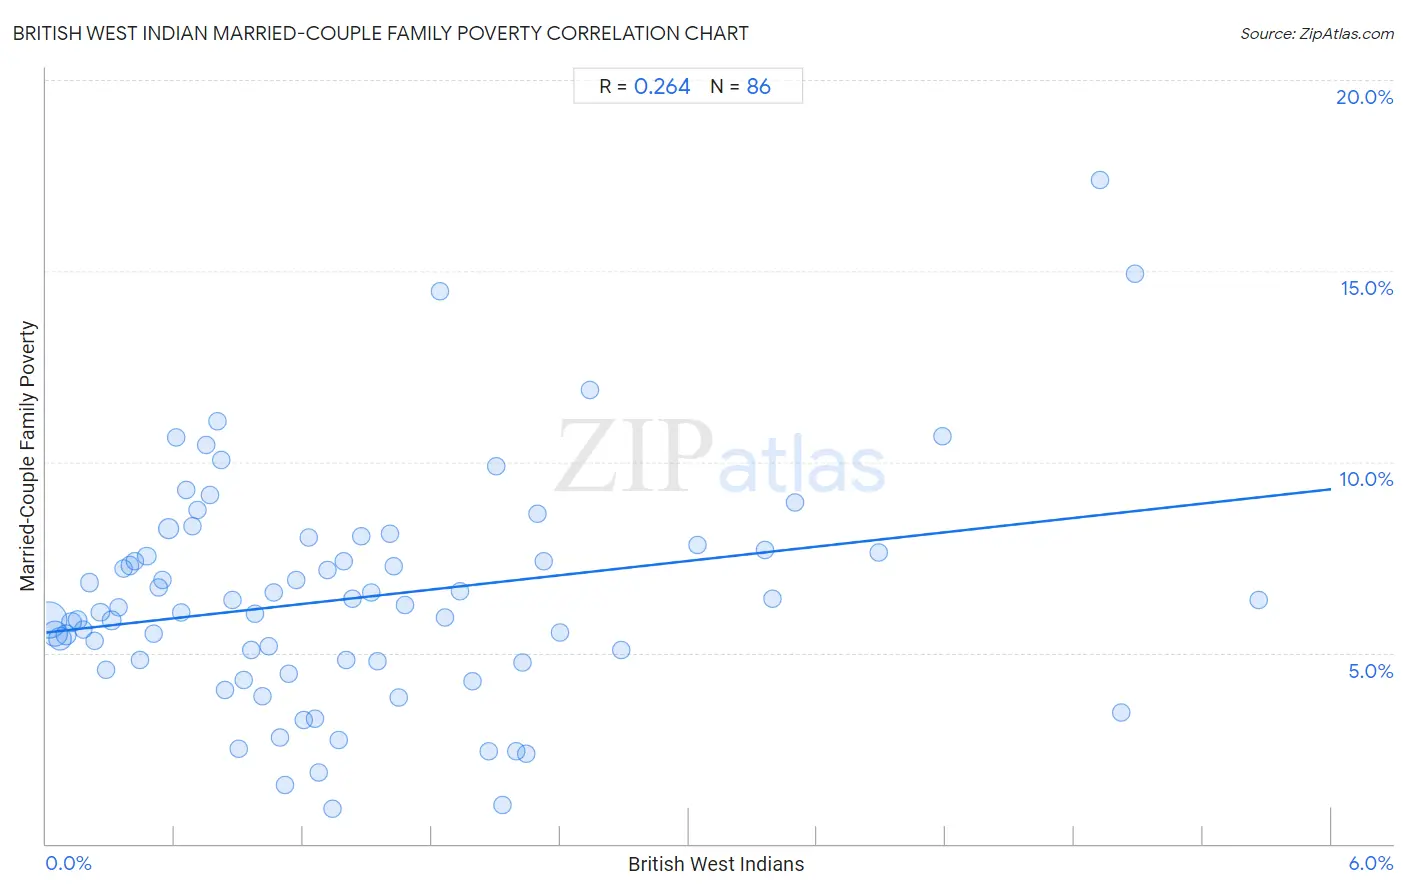
British West Indian Married-Couple Family Poverty Correlation Chart
The statistical analysis conducted on geographies consisting of 152,203,560 people shows a weak positive correlation between the proportion of British West Indians and poverty level among married-couple families in the United States with a correlation coefficient (R) of 0.264 and weighted average of 7.1%. On average, for every 1% (one percent) increase in British West Indians within a typical geography, there is an increase of 0.63% in poverty level among married-couple families.
It is essential to understand that the correlation between the percentage of British West Indians and poverty level among married-couple families does not imply a direct cause-and-effect relationship. It remains uncertain whether the presence of British West Indians influences an upward or downward trend in the level of poverty level among married-couple families within an area, or if British West Indians simply ended up residing in those areas with higher or lower levels of poverty level among married-couple families due to other factors.
Demographics Similar to British West Indians by Married-Couple Family Poverty
In terms of married-couple family poverty, the demographic groups most similar to British West Indians are Inupiat (7.1%, a difference of 0.24%), Immigrants from St. Vincent and the Grenadines (7.1%, a difference of 0.30%), Honduran (7.2%, a difference of 0.39%), Immigrants from Dominica (7.1%, a difference of 0.41%), and Immigrants from Armenia (7.1%, a difference of 0.41%).
| Demographics | Rating | Rank | Married-Couple Family Poverty |
| Guatemalans | 0.0 /100 | #307 | Tragic 7.0% |
| Spanish American Indians | 0.0 /100 | #308 | Tragic 7.1% |
| Hopi | 0.0 /100 | #309 | Tragic 7.1% |
| Immigrants from Nicaragua | 0.0 /100 | #310 | Tragic 7.1% |
| Immigrants from Dominica | 0.0 /100 | #311 | Tragic 7.1% |
| Immigrants from Armenia | 0.0 /100 | #312 | Tragic 7.1% |
| Immigrants from St. Vincent and the Grenadines | 0.0 /100 | #313 | Tragic 7.1% |
| British West Indians | 0.0 /100 | #314 | Tragic 7.1% |
| Inupiat | 0.0 /100 | #315 | Tragic 7.1% |
| Hondurans | 0.0 /100 | #316 | Tragic 7.2% |
| Mexicans | 0.0 /100 | #317 | Tragic 7.2% |
| Immigrants from Guatemala | 0.0 /100 | #318 | Tragic 7.2% |
| Immigrants from Latin America | 0.0 /100 | #319 | Tragic 7.2% |
| Immigrants from Grenada | 0.0 /100 | #320 | Tragic 7.3% |
| Immigrants from Caribbean | 0.0 /100 | #321 | Tragic 7.3% |
British West Indian Married-Couple Family Poverty Correlation Summary
| Measurement | British West Indian Data | Married-Couple Family Poverty Data |
| Minimum | 0.011% | 0.91% |
| Maximum | 5.7% | 17.4% |
| Range | 5.6% | 16.5% |
| Mean | 1.5% | 6.4% |
| Median | 1.2% | 6.2% |
| Interquartile 25% (IQ1) | 0.57% | 4.8% |
| Interquartile 75% (IQ3) | 2.0% | 7.7% |
| Interquartile Range (IQR) | 1.4% | 2.9% |
| Standard Deviation (Sample) | 1.2% | 2.9% |
| Standard Deviation (Population) | 1.2% | 2.9% |
Correlation Details
| British West Indian Percentile | Sample Size | Married-Couple Family Poverty |
[ 0.0% - 0.5% ] 0.011% | 60,109,097 | 5.9% |
[ 0.0% - 0.5% ] 0.039% | 24,508,502 | 5.5% |
[ 0.0% - 0.5% ] 0.065% | 15,838,007 | 5.4% |
[ 0.0% - 0.5% ] 0.093% | 8,692,038 | 5.5% |
[ 0.0% - 0.5% ] 0.12% | 6,235,926 | 5.8% |
[ 0.0% - 0.5% ] 0.15% | 3,644,921 | 5.9% |
[ 0.0% - 0.5% ] 0.17% | 2,723,028 | 5.6% |
[ 0.0% - 0.5% ] 0.20% | 3,203,495 | 6.8% |
[ 0.0% - 0.5% ] 0.23% | 2,445,178 | 5.3% |
[ 0.0% - 0.5% ] 0.25% | 1,668,893 | 6.1% |
[ 0.0% - 0.5% ] 0.28% | 1,148,905 | 4.6% |
[ 0.0% - 0.5% ] 0.31% | 1,548,318 | 5.9% |
[ 0.0% - 0.5% ] 0.34% | 1,144,613 | 6.2% |
[ 0.0% - 0.5% ] 0.36% | 1,409,129 | 7.2% |
[ 0.0% - 0.5% ] 0.39% | 796,655 | 7.3% |
[ 0.0% - 0.5% ] 0.42% | 731,443 | 7.4% |
[ 0.0% - 0.5% ] 0.44% | 404,663 | 4.8% |
[ 0.0% - 0.5% ] 0.47% | 586,011 | 7.5% |
[ 0.5% - 1.0% ] 0.50% | 476,700 | 5.5% |
[ 0.5% - 1.0% ] 0.52% | 336,016 | 6.7% |
[ 0.5% - 1.0% ] 0.54% | 339,099 | 6.9% |
[ 0.5% - 1.0% ] 0.57% | 8,832,985 | 8.3% |
[ 0.5% - 1.0% ] 0.61% | 445,876 | 10.6% |
[ 0.5% - 1.0% ] 0.63% | 248,094 | 6.0% |
[ 0.5% - 1.0% ] 0.65% | 246,395 | 9.3% |
[ 0.5% - 1.0% ] 0.69% | 235,912 | 8.3% |
[ 0.5% - 1.0% ] 0.71% | 171,871 | 8.8% |
[ 0.5% - 1.0% ] 0.74% | 388,738 | 10.5% |
[ 0.5% - 1.0% ] 0.77% | 238,911 | 9.1% |
[ 0.5% - 1.0% ] 0.80% | 168,947 | 11.1% |
[ 0.5% - 1.0% ] 0.82% | 149,233 | 10.0% |
[ 0.5% - 1.0% ] 0.84% | 30,686 | 4.0% |
[ 0.5% - 1.0% ] 0.87% | 137,333 | 6.4% |
[ 0.5% - 1.0% ] 0.90% | 72,026 | 2.5% |
[ 0.5% - 1.0% ] 0.92% | 56,015 | 4.3% |
[ 0.5% - 1.0% ] 0.96% | 149,009 | 5.1% |
[ 0.5% - 1.0% ] 0.98% | 85,015 | 6.0% |
[ 1.0% - 1.5% ] 1.01% | 154,385 | 3.8% |
[ 1.0% - 1.5% ] 1.04% | 150,334 | 5.2% |
[ 1.0% - 1.5% ] 1.06% | 180,523 | 6.6% |
[ 1.0% - 1.5% ] 1.09% | 47,653 | 2.8% |
[ 1.0% - 1.5% ] 1.11% | 13,186 | 1.6% |
[ 1.0% - 1.5% ] 1.13% | 13,586 | 4.5% |
[ 1.0% - 1.5% ] 1.17% | 81,369 | 6.9% |
[ 1.0% - 1.5% ] 1.20% | 49,688 | 3.2% |
[ 1.0% - 1.5% ] 1.23% | 92,388 | 8.0% |
[ 1.0% - 1.5% ] 1.26% | 153,623 | 3.3% |
[ 1.0% - 1.5% ] 1.27% | 37,866 | 1.9% |
[ 1.0% - 1.5% ] 1.31% | 21,595 | 7.2% |
[ 1.0% - 1.5% ] 1.34% | 11,452 | 0.91% |
[ 1.0% - 1.5% ] 1.37% | 12,234 | 2.7% |
[ 1.0% - 1.5% ] 1.39% | 36,471 | 7.4% |
[ 1.0% - 1.5% ] 1.40% | 81,967 | 4.8% |
[ 1.0% - 1.5% ] 1.43% | 73,987 | 6.4% |
[ 1.0% - 1.5% ] 1.47% | 83,165 | 8.1% |
[ 1.5% - 2.0% ] 1.52% | 44,267 | 6.6% |
[ 1.5% - 2.0% ] 1.55% | 43,148 | 4.8% |
[ 1.5% - 2.0% ] 1.61% | 3,795 | 8.1% |
[ 1.5% - 2.0% ] 1.62% | 96,164 | 7.3% |
[ 1.5% - 2.0% ] 1.65% | 19,959 | 3.8% |
[ 1.5% - 2.0% ] 1.67% | 13,515 | 6.3% |
[ 1.5% - 2.0% ] 1.84% | 272 | 14.5% |
[ 1.5% - 2.0% ] 1.86% | 101,222 | 5.9% |
[ 1.5% - 2.0% ] 1.93% | 4,502 | 6.6% |
[ 1.5% - 2.0% ] 1.99% | 62,373 | 4.2% |
[ 2.0% - 2.5% ] 2.07% | 8,277 | 2.4% |
[ 2.0% - 2.5% ] 2.10% | 58,476 | 9.9% |
[ 2.0% - 2.5% ] 2.13% | 1,594 | 1.0% |
[ 2.0% - 2.5% ] 2.20% | 7,424 | 2.4% |
[ 2.0% - 2.5% ] 2.22% | 15,390 | 4.8% |
[ 2.0% - 2.5% ] 2.24% | 1,025 | 2.4% |
[ 2.0% - 2.5% ] 2.29% | 2,703 | 8.6% |
[ 2.0% - 2.5% ] 2.32% | 55,336 | 7.4% |
[ 2.0% - 2.5% ] 2.40% | 24,994 | 5.5% |
[ 2.5% - 3.0% ] 2.54% | 203,405 | 11.9% |
[ 2.5% - 3.0% ] 2.68% | 410 | 5.1% |
[ 3.0% - 3.5% ] 3.04% | 49,104 | 7.8% |
[ 3.0% - 3.5% ] 3.36% | 1,459 | 7.7% |
[ 3.0% - 3.5% ] 3.39% | 101,053 | 6.4% |
[ 3.0% - 3.5% ] 3.50% | 6,408 | 8.9% |
[ 3.5% - 4.0% ] 3.89% | 1,879 | 7.6% |
[ 4.0% - 4.5% ] 4.18% | 526 | 10.7% |
[ 4.5% - 5.0% ] 4.92% | 84,006 | 17.4% |
[ 5.0% - 5.5% ] 5.02% | 100,082 | 3.4% |
[ 5.0% - 5.5% ] 5.08% | 69,131 | 14.9% |
[ 5.5% - 6.0% ] 5.66% | 78,506 | 6.4% |