British West Indian GED/Equivalency
COMPARE
British West Indian
Select to Compare
GED/Equivalency
British West Indian GED/Equivalency
82.0%
GED/EQUIVALENCY
0.0/ 100
METRIC RATING
293rd/ 347
METRIC RANK
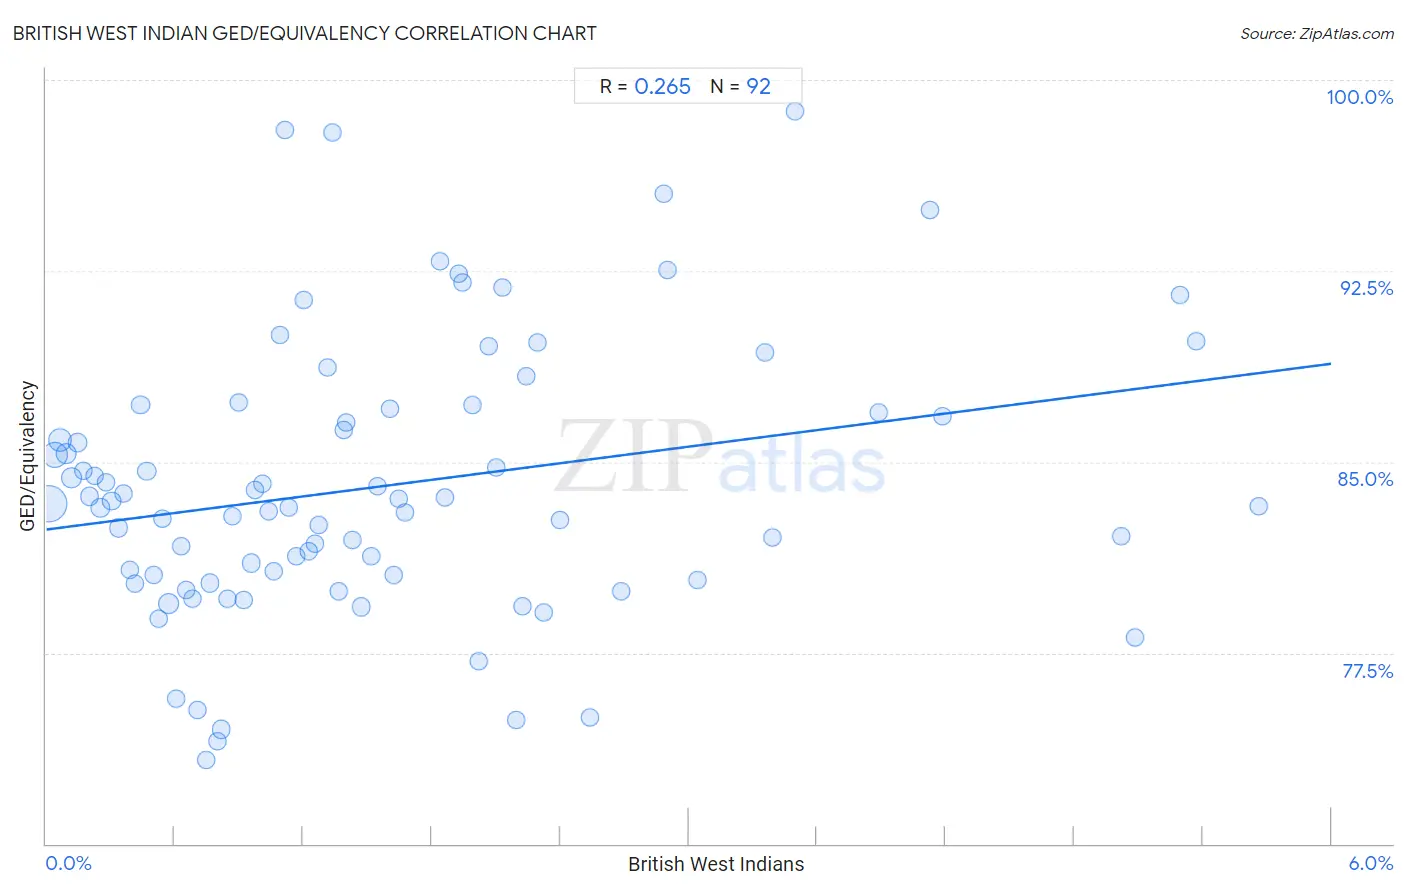
British West Indian GED/Equivalency Correlation Chart
The statistical analysis conducted on geographies consisting of 152,614,591 people shows a weak positive correlation between the proportion of British West Indians and percentage of population with at least ged/equivalency education in the United States with a correlation coefficient (R) of 0.265 and weighted average of 82.0%. On average, for every 1% (one percent) increase in British West Indians within a typical geography, there is an increase of 1.1% in percentage of population with at least ged/equivalency education.
It is essential to understand that the correlation between the percentage of British West Indians and percentage of population with at least ged/equivalency education does not imply a direct cause-and-effect relationship. It remains uncertain whether the presence of British West Indians influences an upward or downward trend in the level of percentage of population with at least ged/equivalency education within an area, or if British West Indians simply ended up residing in those areas with higher or lower levels of percentage of population with at least ged/equivalency education due to other factors.
Demographics Similar to British West Indians by GED/Equivalency
In terms of ged/equivalency, the demographic groups most similar to British West Indians are Paiute (82.0%, a difference of 0.010%), Immigrants from St. Vincent and the Grenadines (82.0%, a difference of 0.030%), Cuban (82.0%, a difference of 0.040%), Haitian (82.1%, a difference of 0.070%), and Nepalese (81.9%, a difference of 0.080%).
| Demographics | Rating | Rank | GED/Equivalency |
| Immigrants from West Indies | 0.0 /100 | #286 | Tragic 82.4% |
| Japanese | 0.0 /100 | #287 | Tragic 82.4% |
| Pueblo | 0.0 /100 | #288 | Tragic 82.3% |
| Immigrants from Cambodia | 0.0 /100 | #289 | Tragic 82.2% |
| Haitians | 0.0 /100 | #290 | Tragic 82.1% |
| Cubans | 0.0 /100 | #291 | Tragic 82.0% |
| Paiute | 0.0 /100 | #292 | Tragic 82.0% |
| British West Indians | 0.0 /100 | #293 | Tragic 82.0% |
| Immigrants from St. Vincent and the Grenadines | 0.0 /100 | #294 | Tragic 82.0% |
| Nepalese | 0.0 /100 | #295 | Tragic 81.9% |
| Vietnamese | 0.0 /100 | #296 | Tragic 81.9% |
| Immigrants from Bangladesh | 0.0 /100 | #297 | Tragic 81.9% |
| Ute | 0.0 /100 | #298 | Tragic 81.8% |
| Ecuadorians | 0.0 /100 | #299 | Tragic 81.7% |
| Fijians | 0.0 /100 | #300 | Tragic 81.6% |
British West Indian GED/Equivalency Correlation Summary
| Measurement | British West Indian Data | GED/Equivalency Data |
| Minimum | 0.011% | 73.3% |
| Maximum | 5.7% | 98.8% |
| Range | 5.6% | 25.5% |
| Mean | 1.6% | 84.1% |
| Median | 1.2% | 83.3% |
| Interquartile 25% (IQ1) | 0.62% | 80.4% |
| Interquartile 75% (IQ3) | 2.1% | 87.0% |
| Interquartile Range (IQR) | 1.5% | 6.6% |
| Standard Deviation (Sample) | 1.3% | 5.4% |
| Standard Deviation (Population) | 1.3% | 5.4% |
Correlation Details
| British West Indian Percentile | Sample Size | GED/Equivalency |
[ 0.0% - 0.5% ] 0.011% | 60,141,745 | 83.4% |
[ 0.0% - 0.5% ] 0.039% | 24,579,479 | 85.3% |
[ 0.0% - 0.5% ] 0.065% | 15,852,161 | 85.9% |
[ 0.0% - 0.5% ] 0.093% | 8,699,139 | 85.3% |
[ 0.0% - 0.5% ] 0.12% | 6,254,435 | 84.4% |
[ 0.0% - 0.5% ] 0.15% | 3,657,920 | 85.8% |
[ 0.0% - 0.5% ] 0.17% | 2,732,814 | 84.6% |
[ 0.0% - 0.5% ] 0.20% | 3,229,227 | 83.6% |
[ 0.0% - 0.5% ] 0.23% | 2,447,371 | 84.5% |
[ 0.0% - 0.5% ] 0.25% | 1,723,506 | 83.2% |
[ 0.0% - 0.5% ] 0.28% | 1,158,447 | 84.2% |
[ 0.0% - 0.5% ] 0.31% | 1,562,920 | 83.4% |
[ 0.0% - 0.5% ] 0.34% | 1,160,573 | 82.4% |
[ 0.0% - 0.5% ] 0.36% | 1,409,129 | 83.8% |
[ 0.0% - 0.5% ] 0.39% | 808,988 | 80.8% |
[ 0.0% - 0.5% ] 0.42% | 743,863 | 80.2% |
[ 0.0% - 0.5% ] 0.44% | 421,684 | 87.2% |
[ 0.0% - 0.5% ] 0.47% | 591,448 | 84.6% |
[ 0.5% - 1.0% ] 0.50% | 476,700 | 80.5% |
[ 0.5% - 1.0% ] 0.52% | 341,465 | 78.9% |
[ 0.5% - 1.0% ] 0.54% | 347,862 | 82.8% |
[ 0.5% - 1.0% ] 0.57% | 8,845,087 | 79.4% |
[ 0.5% - 1.0% ] 0.61% | 455,332 | 75.7% |
[ 0.5% - 1.0% ] 0.63% | 258,100 | 81.7% |
[ 0.5% - 1.0% ] 0.65% | 258,610 | 80.0% |
[ 0.5% - 1.0% ] 0.69% | 242,475 | 79.6% |
[ 0.5% - 1.0% ] 0.71% | 171,871 | 75.2% |
[ 0.5% - 1.0% ] 0.74% | 388,738 | 73.3% |
[ 0.5% - 1.0% ] 0.77% | 240,223 | 80.2% |
[ 0.5% - 1.0% ] 0.80% | 168,947 | 74.0% |
[ 0.5% - 1.0% ] 0.82% | 149,955 | 74.5% |
[ 0.5% - 1.0% ] 0.85% | 49,702 | 79.6% |
[ 0.5% - 1.0% ] 0.87% | 138,485 | 82.9% |
[ 0.5% - 1.0% ] 0.90% | 72,026 | 87.3% |
[ 0.5% - 1.0% ] 0.92% | 60,034 | 79.6% |
[ 0.5% - 1.0% ] 0.96% | 157,080 | 81.0% |
[ 0.5% - 1.0% ] 0.98% | 86,863 | 83.9% |
[ 1.0% - 1.5% ] 1.01% | 156,967 | 84.1% |
[ 1.0% - 1.5% ] 1.04% | 151,206 | 83.1% |
[ 1.0% - 1.5% ] 1.06% | 184,841 | 80.7% |
[ 1.0% - 1.5% ] 1.09% | 47,653 | 90.0% |
[ 1.0% - 1.5% ] 1.11% | 13,186 | 98.0% |
[ 1.0% - 1.5% ] 1.13% | 13,586 | 83.2% |
[ 1.0% - 1.5% ] 1.17% | 81,369 | 81.3% |
[ 1.0% - 1.5% ] 1.20% | 49,688 | 91.4% |
[ 1.0% - 1.5% ] 1.23% | 93,952 | 81.5% |
[ 1.0% - 1.5% ] 1.26% | 153,623 | 81.8% |
[ 1.0% - 1.5% ] 1.27% | 37,866 | 82.5% |
[ 1.0% - 1.5% ] 1.31% | 21,595 | 88.7% |
[ 1.0% - 1.5% ] 1.34% | 11,452 | 97.9% |
[ 1.0% - 1.5% ] 1.37% | 12,234 | 79.9% |
[ 1.0% - 1.5% ] 1.39% | 36,471 | 86.3% |
[ 1.0% - 1.5% ] 1.40% | 84,111 | 86.6% |
[ 1.0% - 1.5% ] 1.43% | 73,987 | 82.0% |
[ 1.0% - 1.5% ] 1.47% | 83,165 | 79.3% |
[ 1.5% - 2.0% ] 1.52% | 44,267 | 81.3% |
[ 1.5% - 2.0% ] 1.55% | 43,148 | 84.0% |
[ 1.5% - 2.0% ] 1.60% | 11,165 | 87.1% |
[ 1.5% - 2.0% ] 1.62% | 96,164 | 80.5% |
[ 1.5% - 2.0% ] 1.65% | 20,442 | 83.6% |
[ 1.5% - 2.0% ] 1.67% | 14,640 | 83.0% |
[ 1.5% - 2.0% ] 1.84% | 272 | 92.9% |
[ 1.5% - 2.0% ] 1.86% | 101,222 | 83.6% |
[ 1.5% - 2.0% ] 1.93% | 9,285 | 92.4% |
[ 1.5% - 2.0% ] 1.94% | 4,734 | 92.0% |
[ 1.5% - 2.0% ] 1.99% | 62,373 | 87.2% |
[ 2.0% - 2.5% ] 2.02% | 8,725 | 77.2% |
[ 2.0% - 2.5% ] 2.07% | 8,277 | 89.5% |
[ 2.0% - 2.5% ] 2.10% | 58,476 | 84.8% |
[ 2.0% - 2.5% ] 2.13% | 1,594 | 91.8% |
[ 2.0% - 2.5% ] 2.20% | 7,424 | 74.9% |
[ 2.0% - 2.5% ] 2.22% | 15,390 | 79.3% |
[ 2.0% - 2.5% ] 2.24% | 1,025 | 88.4% |
[ 2.0% - 2.5% ] 2.29% | 2,703 | 89.7% |
[ 2.0% - 2.5% ] 2.32% | 55,336 | 79.1% |
[ 2.0% - 2.5% ] 2.40% | 24,994 | 82.7% |
[ 2.5% - 3.0% ] 2.54% | 203,405 | 75.0% |
[ 2.5% - 3.0% ] 2.68% | 410 | 79.9% |
[ 2.5% - 3.0% ] 2.89% | 797 | 95.5% |
[ 2.5% - 3.0% ] 2.90% | 4,139 | 92.5% |
[ 3.0% - 3.5% ] 3.04% | 50,744 | 80.4% |
[ 3.0% - 3.5% ] 3.36% | 1,459 | 89.3% |
[ 3.0% - 3.5% ] 3.39% | 101,053 | 82.0% |
[ 3.0% - 3.5% ] 3.50% | 6,408 | 98.8% |
[ 3.5% - 4.0% ] 3.89% | 1,879 | 86.9% |
[ 4.0% - 4.5% ] 4.13% | 4,336 | 94.9% |
[ 4.0% - 4.5% ] 4.18% | 526 | 86.8% |
[ 5.0% - 5.5% ] 5.02% | 100,082 | 82.1% |
[ 5.0% - 5.5% ] 5.08% | 69,131 | 78.1% |
[ 5.0% - 5.5% ] 5.29% | 378 | 91.5% |
[ 5.0% - 5.5% ] 5.37% | 8,326 | 89.7% |
[ 5.5% - 6.0% ] 5.66% | 78,506 | 83.3% |